U.S. third-party logistics (3PL) market revenues increased modestly in 2012 in a slow dance mirrored by the U.S. gross domestic product (GDP). Results outside the U.S. reflected a recessionary Europe and warm but not hot results in Asia.
U.S. 3PL market gross revenues increased by 6% to $141.8 billion.
U.S. 3PL Market 1996-2013E (US$ Billions)
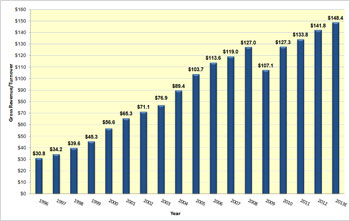
The 3PL market compound annual growth rate (CAGR) from 1996 to 2012 fell 0.3% to 10%. With U.S. governmental "sequestration" spending cuts kicking in, it is unlikely that the U.S. economy and 3PL market results will break the trend in 2013. A temporary budget surplus has taken pressure off of politicians to find solutions for huge, long-term U.S. deficit challenges. As John Maynard Keynes turns in his grave, the U.S. economy will grow slowly until the next major crisis.
Domestic transportation management (DTM) led financial results for 3PL segments again in 2012. Gross revenues were up 9.2%. At the same time, the cost of purchasing transportation, increased competition, and slackened demand are pressuring DTM gross margins and net revenues. As a result, net revenues increased by only 5.4%. Overall gross margins were 14.6%. In 2011 they were 15.2%. 3PL earnings before interest and tax (EBITs) and net income margins remained strong. They were 33.2% and 20.3% of net revenue respectively.
Revenues and Profitability by 3PL Segment – 2012
| 3PL Segment | Gross Revenue (Turnover) (US$ Billions) | % Change 2012 vs. 2011 | Net Revenue (US$ Billions) | % Change 2012 vs. 2011 | Net Income (Profit Margin %) | % Change 2012 vs. 2011 |
| Domestic Transportation Management | 45.1 | 9.20% | 6.6 | 5.40% | 20.3 | 16.70% |
| International Transportation Management | 46.3 | 0.40% | 17.9 | 1.00% | 7 | -4.10% |
| Dedicated Contract Carriage | 11.6 | 4.50% | 11.4 | 4.70% | 5.2 | 15.60% |
| Value-Added Warehousing and Distribution | 35.8 | 5.30% | 27.6 | 3.80% | 2.9 | -3.30% |
| Total* | 138.8 | 6.00% | 63.5 | 4.10% | 6.5 | 6.60% |

_-_28de80_-_8f8c6366d00d2f1fde1eee7fbc1f9ce9fbad4504_yes.png)