“This past July was our best July ever on record for us, just as this past June and May were the best of those months, historically speaking,” said Virginia Port Authority Executive Director Jerry A. Bridges. “We saw increase in rail moves, barge moves, ship calls and containers handled at the Virginia Inland Port.”
Total rail containers handled in July were 32,941, a 22.5 percent increase when compared with last July. The year-to-date rail containers total is 212,689 vs. 186,900 for the same period last year; an increase of 13.8 percent.
The number of containers moved between the Port of Richmond and the Hampton Roads Harbor on the 64 Express barge service in July was 401, an increase of 30.6 percent when compared with last July. The year-to-date total for the barge is up 95.8 percent: 5,198 containers vs. 2,655 containers handled during the same period in 2011.
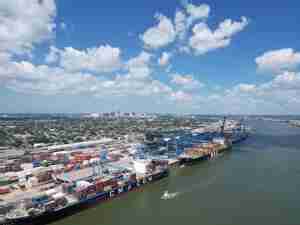
In July there were 173 ship calls vs. 156 for the same month last year, an increase of 10.9 percent. The year-to-date ship calls total is 1,138 vs. 1,051 for the same period last year, an increase of 8.3 percent.
Virginia Inland Port (VIP) in July saw a 17.6 percent increase in the number of containers it handled when compared with the same month last year: 2,328 vs. 1,979. Year-to-date, VIP is running about 1 percent ahead of last year.
Also in July the breakbulk total was 24,377 tons, a decrease of 23.7 percent increase when compared with totals from last July. Still, the year-to-date breakbulk comparison in tons (2012 vs. 2011) has increased 5.6 percent: 212,698 vs. 186,900, respectively.
Calendar year TEU totals, 2012 vs. 2011:
• July 2012 = 180,834
• July 2011 – 167,076
• June 2012 = 168,430
• June 2011 = 151,449
• May 2012 = 178,584
• May 2011 =158,539
• April 2012 = 169,644
• April 2011 = 161,254
• March 2012 = 166,719
• March 2011 = 159,754
• February 2012 = 157,050
• February 2011 = 153,646
• January 2012 = 154,300
• January 2011 = 159,265