 The January 2012 to January 2013 decrease in imports of goods reflected decreases in industrial supplies and materials ($4.2 billion); automotive vehicles, parts, and engines ($0.3 billion); and foods, feeds, and beverages ($0.2 billion). Increases occurred in consumer goods ($1.4 billion); capital goods ($1.3 billion); and other goods ($0.3 billion).
Services
Exports of services decreased $0.1 billion from December to January. Decreases in other transportation ($0.2 billion), which includes freight and port services, and travel ($0.2 billion), were partly offset by increases in other private services ($0.2 billion) which includes items such as business, professional, and technical services, insurance services, and financial services, and passenger fares ($0.1 billion). Changes in the other categories of services exports were relatively small.
Imports of services increased $0.5 billion from December to January. The increase reflected increases in travel ($0.2 billion), other transportation ($0.1 billion), passenger fares ($0.1 billion), and other private services ($0.1 billion). Changes in the other categories of services imports were relatively small.
The January 2012 to January 2013 increase in exports of services was $2.8 billion or 5.5 percent. The largest
The January 2012 to January 2013 decrease in imports of goods reflected decreases in industrial supplies and materials ($4.2 billion); automotive vehicles, parts, and engines ($0.3 billion); and foods, feeds, and beverages ($0.2 billion). Increases occurred in consumer goods ($1.4 billion); capital goods ($1.3 billion); and other goods ($0.3 billion).
Services
Exports of services decreased $0.1 billion from December to January. Decreases in other transportation ($0.2 billion), which includes freight and port services, and travel ($0.2 billion), were partly offset by increases in other private services ($0.2 billion) which includes items such as business, professional, and technical services, insurance services, and financial services, and passenger fares ($0.1 billion). Changes in the other categories of services exports were relatively small.
Imports of services increased $0.5 billion from December to January. The increase reflected increases in travel ($0.2 billion), other transportation ($0.1 billion), passenger fares ($0.1 billion), and other private services ($0.1 billion). Changes in the other categories of services imports were relatively small.
The January 2012 to January 2013 increase in exports of services was $2.8 billion or 5.5 percent. The largest
US International Trade in goods and services
posted by AJOT | Jul 02 2013 at 08:00 PM | International Trade
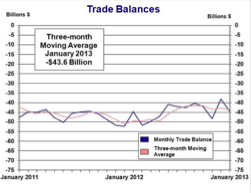
The U.S. Census Bureau and the U.S. Bureau of Economic Analysis, through the Department of Commerce, announced today that total January exports of $184.5 billion and imports of $228.9 billion resulted in a goods and services deficit of $44.4 billion, up from $38.1 billion in December, revised. January exports were $2.2 billion less than December exports of $186.6 billion. January imports were $4.1 billion more than December imports of $224.8 billion.
In January, the goods deficit increased $5.7 billion from December to $61.8 billion, and the services surplus decreased $0.6 billion from December to $17.3 billion. Exports of goods decreased $2.0 billion to $130.8 billion, and imports of goods increased $3.6 billion to $192.5 billion. Exports of services decreased $0.1 billion to $53.7 billion, and imports of services increased $0.5 billion to $36.4 billion.
The goods and services deficit decreased $7.8 billion from January 2012 to January 2013. Exports were up $5.8 billion, or 3.3 percent, and imports were down $2.0 billion, or 0.9 percent.
Goods (Census Basis)
The December to January decrease in exports of goods reflected decreases in industrial supplies and materials ($2.6 billion) and other goods ($1.0 billion). Increases occurred in capital goods ($0.7 billion); foods, feeds, and beverages ($0.4 billion); consumer goods ($0.3 billion); and automotive vehicles, parts, and engines ($0.2 billion).
The December to January increase in imports of goods reflected increases in industrial supplies and materials ($4.0 billion); other goods ($0.7 billion); and capital goods ($0.5 billion). Decreases occurred in consumer goods ($0.9 billion) and automotive vehicles, parts, and engines ($0.7 billion). Foods, feeds, and beverages were virtually unchanged.
The January 2012 to January 2013 increase in exports of goods reflected increases in foods, feeds, and beverages ($1.2 billion); capital goods ($1.1 billion); consumer goods ($1.0 billion); and other goods ($0.3 billion). Decreases occurred in industrial supplies and materials ($0.3 billion) and automotive vehicles, parts, and engines ($0.3 billion).
NOTE: Total goods data are reported on a balance of payments basis unless otherwise specified. Commodity and country data for goods are on a Census basis. Monthly statistics are seasonally adjusted unless otherwise specified. For information on data sources and definitions, see the information section on page A-1 of this release, or at www.census.gov/ft900 or www.bea.gov/newsreleases/international/trade/tradnewsrelease.htm. The next FT-900 release is April 5, 2013.
The January 2012 to January 2013 decrease in imports of goods reflected decreases in industrial supplies and materials ($4.2 billion); automotive vehicles, parts, and engines ($0.3 billion); and foods, feeds, and beverages ($0.2 billion). Increases occurred in consumer goods ($1.4 billion); capital goods ($1.3 billion); and other goods ($0.3 billion).
Services
Exports of services decreased $0.1 billion from December to January. Decreases in other transportation ($0.2 billion), which includes freight and port services, and travel ($0.2 billion), were partly offset by increases in other private services ($0.2 billion) which includes items such as business, professional, and technical services, insurance services, and financial services, and passenger fares ($0.1 billion). Changes in the other categories of services exports were relatively small.
Imports of services increased $0.5 billion from December to January. The increase reflected increases in travel ($0.2 billion), other transportation ($0.1 billion), passenger fares ($0.1 billion), and other private services ($0.1 billion). Changes in the other categories of services imports were relatively small.
The January 2012 to January 2013 increase in exports of services was $2.8 billion or 5.5 percent. The largest