Air cargo growth outpacing trade growth - upward trend continues
posted by AJOT | Apr 03 2017 at 08:25 AM | Air Cargo
Regular followers of market trends know that year-over-year (YoY) comparisons for the early months of the year should be treated with caution, such is the influence of the timing of Chinese New Year on the world's air cargo flows.
Looking therefore at January & February combined, the start of 2017 has been promising with a YoY growth of 6.3% in kilograms and 7.4% in DTK's (Direct Ton Kilometers, the measure combining weight with the geographical distance between origin and destination of shipments). The three largest regions grew more, both in outgoing and in incoming kilograms: Asia Pacific +11%, North America +7% and Europe +6.5%. Allowing for the fact that we had one day less (as 2016 was a leap year), the worldwide growth could be said to be even higher, i.e. 8% in kilograms and 9.1% in DTK's.
In other words, the strong YoY growth we already saw for Q4 2016, continued unabated in the new year. One underlying factor may well have been the changed business pattern around Chinese New Year. As a rule, the volumes in the 'week after' drop considerably compared to the 'last week before', not only from Asia Pacific but also worldwide. Last year, business from Asia Pacific dropped to a level of 43% of the top-week (worldwide to 76%). This year, not only was the drop smaller (to 51% from Asia Pacific, and to 83% worldwide), but business also returned more quickly to normal levels after the 'week after'.
Are these signs a harbinger of good times to come? Air cargo seems to ride the wave of an improving world economy, making for a good outlook for this year. Yet, we should caution against expectations of the present YoY growth percentages continuing. After all, the impressive growth percentages of the past half year were possible because of the relative weakness in the equivalent period one year earlier.
Worldwide yield (in USD) in the period Jan/Feb 2017 lost 5.9% to the latest two months of 2016: a year ago, the comparable drop was 8.3%. Viewing Jan/Feb 2017 against Jan/Feb 2016, we see a yield drop of 2.6% in USD-terms, but a 0.6 % yield rise, when measured in EUR. So, the good news is that Jan/Feb-revenues increased YoY. However, seen against the backdrop of jet fuel prices rising strongly YoY, margins for airlines continued to be fragile.
Forwarders & Product Categories
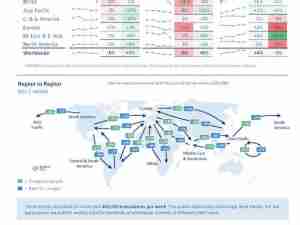
This month, we take a brief look at the position of the world's top-20 forwarders in 2016. With a worldwide share in General Cargo of 46%, they are strongest in the air cargo markets of Asia Pacific, Europe and North America. In Africa, MESA and Latin America, their shares were way below, with 20%, 25% and 28% respectively. The top-20's share in all specialist products worldwide remained at 36% only, ranging from an 8% share in Live Animals and Valuables to a 66% share in Pharmaceuticals.
We see very clear regional differences, underscoring the existing specialization among forwarders. In the Live Animals business from North America, the largest market of this kind, the Top-20's share is 5% only. In Perishables from Africa, it is 18%. On the other hand, the big guns dominate the largest Pharmaceuticals market Europe, with a share of 75%, and the market in Vulnerables (mostly electronics) from Asia Pacific, with a share of 64%.