Real gross domestic product (GDP) increased at an annual rate of 2.6 percent in the fourth quarter of 2022 (table 1), according to the "third" estimate released by the Bureau of Economic Analysis. In the third quarter, real GDP increased 3.2 percent.
The GDP estimate released today is based on more complete source data than were available for the "second" estimate issued last month. In the second estimate, the increase in real GDP was 2.7 percent. The revision primarily reflected downward revisions to exports and consumer spending (refer to "Updates to GDP"). Imports, which are a subtraction in the calculation of GDP, were revised down.

The increase in real GDP primarily reflected increases in private inventory investment, consumer spending, nonresidential fixed investment, federal government spending, and state and local government spending that were partly offset by decreases in residential fixed investment and exports. Imports decreased (table 2).
The increase in private inventory investment was led by manufacturing (mainly petroleum and coal products) as well as mining, utilities, and construction (led by utilities). The increase in consumer spending reflected an increase in services that was partly offset by a decrease in goods. Within services, the increase was led by health care as well as housing and utilities. Within goods, the leading contributor to the decrease was "other" durable goods (mainly jewelry). Within nonresidential fixed investment, increases in structures and intellectual property products (mainly software) were partly offset by a decrease in equipment. The increase in federal government spending was led by nondefense spending. The increase in state and local government spending primarily reflected an increase in the compensation of state and local government employees.
Within residential fixed investment, the leading contributors to the decrease were new single-family construction and brokers' commissions. Within exports, a decrease in goods (led by nondurable goods excluding petroleum) was partly offset by an increase in services (led by travel as well as transport). Within imports, both goods (led by durable consumer goods) and services (led by transport) decreased.
Real GDP decelerated in the fourth quarter, increasing 2.6 percent after increasing 3.2 percent in the third quarter. The deceleration primarily reflected a downturn in exports and decelerations in consumer spending, nonresidential fixed investment, and state and local government spending. These movements were partly offset by an upturn in private inventory investment, a smaller decrease in residential fixed investment, and an acceleration in federal government spending. Imports decreased less in the fourth quarter than in the third quarter.
Current‑dollar GDP increased 6.6 percent at an annual rate in the fourth quarter, or $414.1 billion, to a level of $26.14 trillion, a downward revision of 0.1 percentage point, or $7.0 billion, from the previous estimate (tables 1 and 3). More information on the source data that underlie the estimates is available in the "Key Source Data and Assumptions" file on BEA's website.
The price index for gross domestic purchases increased 3.6 percent in the fourth quarter, the same as previously estimated (table 4). The PCE price index increased 3.7 percent, the same as previously estimated. Excluding food and energy prices, the PCE price index increased 4.4 percent, an upward revision of 0.1 percentage point.
Personal Income
Current-dollar personal income increased $398.8 billion in the fourth quarter, an upward revision of $10.8 billion. The increase primarily reflected increases in compensation (led by private wages and salaries) and government social benefits (table 8). Within government social benefits, the increase primarily reflected an increase in "other" benefits reflecting state stimulus payments to individuals in the form of one-time refundable tax credits. Disposable personal income increased $403.0 billion, or 8.9 percent, an upward revision of $10.9 billion from the previous estimate. Real disposable personal income increased 5.0 percent, an upward revision of 0.2 percentage point from the previous estimate.
Personal saving was $758.8 billion in the fourth quarter, an upward revision of $3.8 billion from the previous estimate. The personal saving rate—personal saving as a percentage of disposable personal income—was 4.0 percent, an upward revision of 0.1 percentage point from the previous estimate.
Gross Domestic Income and Corporate Profits
Real gross domestic income (GDI) decreased 1.1 percent in the fourth quarter, in contrast to an increase of 2.8 percent in the third quarter. The average of real GDP and real GDI, a supplemental measure of U.S. economic activity that equally weights GDP and GDI, increased 0.7 percent in the fourth quarter, compared with an increase of 3.0 percent in the third quarter (table 1).
Profits from current production (corporate profits with inventory valuation and capital consumption adjustments) decreased $60.5 billion in the fourth quarter, compared with a decrease of $1.3 billion in the third quarter (table 10).
Profits of domestic financial corporations decreased $59.0 billion in the fourth quarter, compared with a decrease of $1.8 billion in the third quarter. Profits of domestic nonfinancial corporations decreased $22.9 billion, in contrast to an increase of $16.1 billion. Rest-of-the-world profits increased $21.4 billion, in contrast to a decrease of $15.5 billion. In the fourth quarter, receipts increased $7.2 billion, and payments decreased $14.2 billion.
Updates to GDP
With the third estimate, downward revisions to exports and consumer spending were partly offset by upward revisions to nonresidential fixed investment, residential fixed investment, and state and local government spending. Imports, which are a subtraction in the calculation of GDP, were revised down.
| Advance Estimate | Second Estimate | Third Estimate | |
|---|---|---|---|
| (Percent change from preceding quarter) | |||
| Real GDP | 2.9 | 2.7 | 2.6 |
| Current-dollar GDP | 6.5 | 6.7 | 6.6 |
| Real GDI | … | … | -1.1 |
| Average of Real GDP and Real GDI | … | … | 0.7 |
| Gross domestic purchases price index | 3.2 | 3.6 | 3.6 |
| PCE price index | 3.2 | 3.7 | 3.7 |
| PCE price index excluding food and energy | 3.9 | 4.3 | 4.4 |
Real GDP by Industry
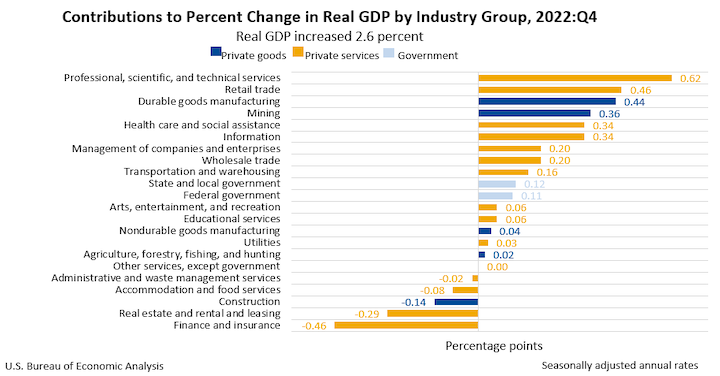
Today's release includes estimates of GDP by industry, or value added—a measure of an industry's contribution to GDP. In the fourth quarter, private goods-producing industries increased 4.0 percent, private services-producing industries increased 2.3 percent, and government increased 2.1 percent (table 12). Overall, 17 of 22 industry groups contributed to the fourth-quarter increase in real GDP.
- Within private goods-producing industries, the increase was led by durable goods manufacturing and mining. Partly offsetting these increases was a decrease in construction.
- Within private services-producing industries, the leading contributors to the increase were professional, scientific, and technical services; retail trade; health care and social assistance; and information. Notable offsets include decreases in finance and insurance as well as real estate and rental and leasing.
- The increase in government reflected increases in both federal government as well as state and local government.

Gross Output by Industry
Real gross output—principally a measure of an industry's sales or receipts, which includes sales to final users in the economy (GDP) and sales to other industries (intermediate inputs)—increased 1.0 percent. In the fourth quarter, private goods-producing industries increased 2.4 percent, private services-producing industries increased 0.1 percent, and government increased 3.4 percent (table 16). Overall, 11 of 22 industry groups contributed to the increase in real gross output.
GDP for 2022
Real GDP increased 2.1 percent in 2022 (from the 2021 annual level to the 2022 annual level), compared with an increase of 5.9 percent in 2021 (table 1). The increase in real GDP in 2022 primarily reflected increases in consumer spending, exports, private inventory investment, and nonresidential fixed investment that were partly offset by decreases in residential fixed investment and federal government spending. Imports increased (table 2).
Current-dollar GDP increased 9.2 percent, or $2.15 trillion, in 2022 to a level of $25.46 trillion, compared with an increase of 10.7 percent, or $2.25 trillion, in 2021 (tables 1 and 3).
The price index for gross domestic purchases increased 6.8 percent in 2022, compared with an increase of 4.2 percent in 2021 (table 4). The PCE price index increased 6.3 percent, compared with an increase of 4.0 percent. Excluding food and energy prices, the PCE price index increased 5.0 percent, compared with an increase of 3.5 percent.
Measured from the fourth quarter of 2021 to the fourth quarter of 2022, real GDP increased 0.9 percent during the period (table 5), compared with an increase of 5.7 percent from the fourth quarter of 2020 to the fourth quarter of 2021.
The price index for gross domestic purchases, as measured from the fourth quarter of 2021 to the fourth quarter of 2022, increased 6.2 percent, compared with an increase of 5.8 percent from the fourth quarter of 2020 to the fourth quarter of 2021. The PCE price index increased 5.7 percent, the same increase as from the fourth quarter of 2020 to the fourth quarter of 2021. Excluding food and energy, the PCE price index increased 4.8 percent, compared with an increase of 4.7 percen
Gross Domestic Income and Corporate Profits for 2022
Real GDI increased 2.3 percent in 2022, compared with an increase of 5.5 percent in 2021 (table 1). The average of real GDP and real GDI increased 2.2 percent in 2022, compared with an increase of 5.7 percent in 2021.
In 2022, profits from current production increased $181.5 billion, compared with an increase of $511.0 billion in 2021. Profits of domestic financial corporations decreased $52.0 billion, in contrast to an increase of $69.0 billion (table 10). Profits of domestic nonfinancial corporations increased $192.3 billion, compared with an increase of $459.2 billion. Rest-of the-world profits increased $41.2 billion, in contrast to a decrease of $17.3 billion.
| Advance Estimate | Second Estimate | Third Estimate | |
|---|---|---|---|
| (Percent change from 2021 annual level to 2022 annual level) | |||
| Real GDP | 2.1 | 2.1 | 2.1 |
| Current-dollar GDP | 9.2 | 9.2 | 9.2 |
| Real GDI | … | … | 2.3 |
| Average of Real GDP and Real GDI | … | … | 2.2 |
| Gross domestic purchases price index | 6.8 | 6.8 | 6.8 |
| PCE price index | 6.2 | 6.3 | 6.3 |
| PCE price index excluding food and energy | 5.0 | 5.0 | 5.0 |
| (Percent change from fourth quarter 2021 to fourth quarter 2022) | |||
| Real GDP | 1.0 | 0.9 | 0.9 |
| Real GDI | … | … | 0.4 |
| Average of Real GDP and Real GDI | … | … | 0.6 |
| Gross domestic purchases price index | 6.1 | 6.2 | 6.2 |
| PCE price index | 5.5 | 5.7 | 5.7 |
| PCE price index excluding food and energy | 4.7 | 4.8 | 4.8 |