posted by AJOT | Nov 23 2016 at 08:12 AM | Intermodal
Index Off 0.9% from October 2015
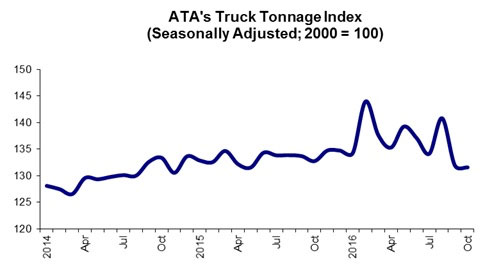
Arlington, Va. — American Trucking Associations’ advanced seasonally adjusted (SA) For-Hire Truck Tonnage Index contracted 0.3% in October, following a 6.3% drop during September (a downward revision from our press release last month). In October, the index equaled 131.6 (2000=100), down from 131.9 in September. The all-time high was 144 in February. Compared with October 2015, the SA index fell 0.9%, the second straight year-over-year decline. In September, the year-over-year drop was 1.3%. Year-to-date, compared with the same period in 2015, tonnage was up 2.5%.
The not seasonally adjusted index, which represents the change in tonnage actually hauled by the fleets before any seasonal adjustment, equaled 138.2 in October, which was 1.9% above the previous month (135.6).
“While seasonally adjusted tonnage fell, meaning the not seasonally adjusted gain wasn’t as large as expected, the bottom of the current tonnage cycle should be near,” said ATA Chief Economist Bob Costello. “There are some recent trends that suggest truck freight should improve, albeit gradually, soon.
“Retail sales, housing starts, and even factory output all improved in October, which is a good sign. Most importantly, there has been considerable progress made in clearing out excess stocks throughout the supply chain. While that correction is still ongoing, there has been enough improvement that the negative drag on tonnage shouldn’t be as large going forward,” he said.
Trucking serves as a barometer of the U.S. economy, representing 70.1% of tonnage carried by all modes of domestic freight transportation, including manufactured and retail goods. Trucks hauled nearly 10.5 billion tons of freight in 2015. Motor carriers collected $726.4 billion, or 81.2% of total revenue earned by all transport modes.
ATA calculates the tonnage index based on surveys from its membership and has been doing so since the 1970s. This is a preliminary figure and subject to change in the final report issued around the 10th day of the month. The report includes month-to-month and year-over-year results, relevant economic comparisons and key financial indicators.
More Intermodal
Fortress-backed Brightline asks investors to bet on Florida rail
Shares of truckmaker Volvo AB dropped as much as 5.9% in Stockholm on Friday on news that China’s Zhejiang Geely Holding Group had sold the entirety of its Class B…