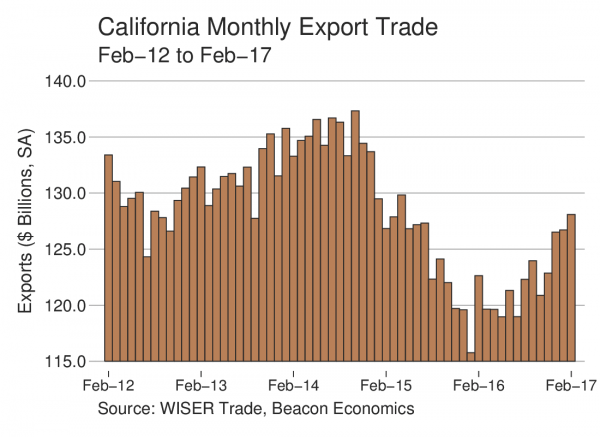
California’s merchandise export trade had an exceptionally strong showing in February, although merchandise imports pulled back in the latest numbers, according to a Beacon Economics’ analysis of U.S. trade statistics released this morning by the U.S. Census Bureau.
“With double-digit increases in the first two months of the year, California’s export activity is off to a good start in 2017,”said Robert Kleinhenz, Economist and Executive Director of Research at Beacon Economics. “Meanwhile, with steady growth expected in the U.S. this year, one should not read too much into the pullback in imports in February.”
According to the latest Census data, foreign shipments by California businesses totaled $13.46 billion for the month, a robust 11.0% increase over the $12.13 billion recorded in February 2016.
“The numbers continue to defy conventional expectations that a strong dollar would discourage exports,” said Jock O’Connell, Beacon Economics’ International Trade Advisor.
The state’s exports of manufactured goods in February rose by 15.4% to $8.91 billion from $7.72 billion one year earlier. Exports of non-manufactured goods (chiefly agricultural products and raw materials) increased 7.5% to $1.57 billion from $1.46 billion. Re-exports, meanwhile, edged up 1.0% to $2.98 billion from $2.95 billion.
By way of comparison, the nominal value of overall U.S. merchandise exports in February rose 4.9%. California accounted for 11.3 % of the nation’s overall merchandise export trade.
The gains were reflected in the increased volume of outbound traffic at the state’s principal international trade gateways. Airborne export tonnage from LAX and SFO was up 19.8% from last February, while the number of outbound loaded containers sailing from the Ports of Los Angeles, Long Beach, and Oakland rose by 2.2% over February 2016.
California Imports Fall
The U.S. Department of Commerce has determined that California was the state-of-destination for 18.2% of all U.S. merchandise imports in February, with a value of $29.68 billion, down 5.5% from the $31.41 billion in imported goods in February 2016. Manufactured imports totaled $26.34 billion, a decline of 8.3% from $28.71 billion last year. Non-manufactured imports in February were valued at $3.35 billion, 24.13% higher than the $2.70 billion recorded a year earlier.
A Closer Look At The Numbers
As always, Beacon Economics cautions against reading too much into month-to-month fluctuations in state export statistics, especially when focusing on specific commodities or destinations. Significant variations can occur as the result of unusual developments or exceptional one-off trades and may not be indicative of underlying trends.For that reason, Beacon Economics compares the latest three months for which data are available (i.e., December-February) with the corresponding period one year earlier.
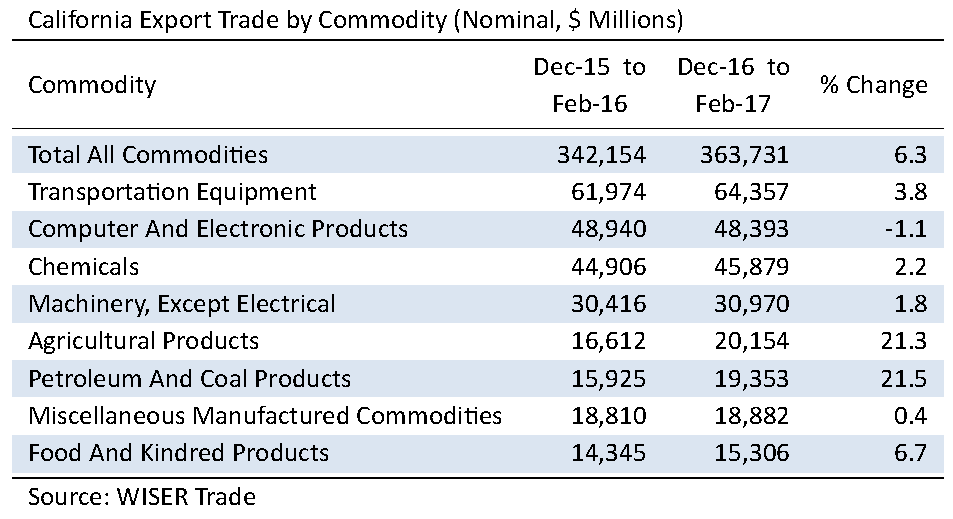
California’s merchandise exports during the latest three-month period totaled $40.77 billion, a nominal gain of 10.4% over the $36.94 billion in the earlier period. Nine of the ten leading categories of exports saw increases. On the plus side, the top export category of Computer & Electronic Products (computers and peripherals; communication, audio, and video equipment; navigational controls; and electro-medical instruments) grew by 0.1% to $9.89 billion from $9.88 billion.
The state’s exports of Transportation Equipment (automobiles, trucks, trains, boats, airplanes, and their parts) leapt by 24.8% to $5.07 billion from $4.06 billion. Exports of Non-Electrical Machinery (machinery for industrial, agricultural and construction uses as well as ventilation, heating, and air conditioning equipment) likewise soared by 26.2% to $3.99 billion from $3.16 billion. Exports of Miscellaneous Manufactured Commodities (a catchall category of merchandise ranging from medical equipment to sporting goods) jumped 6.1% to $3.18 billion from $3.0 billion.
Agricultural exports were up 2.2% to $3.0 billion from $2.94 billion, while foreign shipments of Food & Kindred goods rose 4.4% to $2.12 billion from $2.03 billion. Exports of Electrical Equipment and Appliances nudged up 4.8% to $1.75 billion from $1.67 billion, while exports of Primary Metal Manufacturing products were 59.7% higher at $1.71 billion from 1.07 billion.
On the downside, chemical exports (including pesticides and fertilizers; pharmaceutical products; paints and adhesives; soap and cleaning products; and raw plastics, resins, and rubber) slipped by 1.5% to $3.03 billion from $3.08 billion.
Mexico remained California’s most important export destination during the last three months, despite sharp gyrations in the value of the peso. Shipments south of the border rose 3.9% to $6.17 billion from $6.04 billion. Exports to China jumped 26.4% to $3.97 billion from $3.14 billion. In third place was Canada (until recently California’s second leading export destination) with $3.63 billion in exports, off 1.9% from $3.70 billion one year earlier. With a major recent surge, Hong Kong moved into the fourth place with $3.41 billion in exports from California, up 52.3% from $2.24 billion. Japan, up 11.2% to $2.99 billion from $2.69 billion, rounded out the list of California’s Top Five export markets.
The state’s export trade with the economies of East Asia increased 23.3% to $16.08 billion from $13.04 billion. By contrast, California’s exports to the European Union moved up by just 5.4% to $7.26 billion from $6.89 billion.
Mexico and Canada, America’s partners in the North American Free Trade Area, accounted for 24.1% of California’s merchandise export trade in the latest three-month period. Exports to our two neighbors rose a combined 1.7% to $9.81 billion from $9.65 a year earlier. By mode of transport, 47.8% of the state’s $40.77 billion merchandise export trade during the most recent three months went by air, while waterborne transport carried 30.9%. The balance travelled overland to Canada and Mexico.
The Outlook
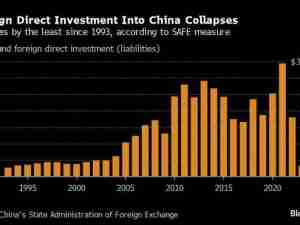
Economic conditions abroad are looking increasingly more favorable for California exporters. Prospects for growth in both Mexico and Canada are improving, and the peso has been recovering since falling to a record low against the dollar around the time of Donald Trump’s inauguration. Despite a litany of challenges, the European Union’s outlook is also brightening. And China’s economy is growing at rates that, while slower than in recent years, are still much higher than most anywhere else.
This report comes just ahead of President Trump’s meeting with Chinese President Xi Jinping in Florida. While we do not expect to see any dramatic announcements (after all, drafts of official closing statements have reportedly been circulating for weeks), we do fear that a flair-up over one or more non-economic issues (North Korea’s nuclear weapons program or Chinese militarization of the South China Sea) could have profound consequences for bilateral trade.
More generally, we are cautiously encouraged by the more moderate tone on foreign trade issues the Trump administration has lately adopted. Most notably, the draft agenda for renegotiating the North America Free Trade Agreement, submitted to Congress last month, was devoid of Trump’s strident rhetoric and brash promises to “tear up” NAFTA. Still, we remain mindful that, with this administration, positions can abruptly change, especially if there is vigorous push back from NAFTA foes in Congress and among Trump’s political base. The White House continues to broadcast mixed signals on trade policy, as hard liners clash with those who maintain more tempered views on trade. It is far from apparent how internal debates will shape trade policy in the coming months.
Note: The U.S. Commerce Department has been publishing state-of-destination import statistics since 2008. Beacon Economics has long felt that state import data provide a highly misleading indication of the state in which imported goods were ultimately consumed. As a major gateway for the nation’s foreign trade, California has consistently been credited with an out-sized share of U.S. merchandise imports. However, we now believe that the process by which state-of-destination import statistics are compiled has become stable enough to be used to measure relative increases or decreases in the value of imported goods consumed or otherwise used by residents or businesses located in California. We emphasize that we are primarily interested in determining trends. We continue to think it highly inadvisable to combine state export and import statistics to calculate a state trade balance.
More International Trade
Dollar wrecking ball forces investors to seek cover in exporters
Blinken lands in China for tense talks as US sanctions loom
Secretary of State Antony Blinken has arrived in China on a mission to press Beijing on issues including its support for Russia and industrial overcapacity, with the threat of new…
US warns of sanctions risk as Pakistan inks deals with Iran
The US has warned of sanctions risks for Pakistan after the government in Islamabad signed security and economic deals with Iran during a visit by President Ebrahim Raisi to the…