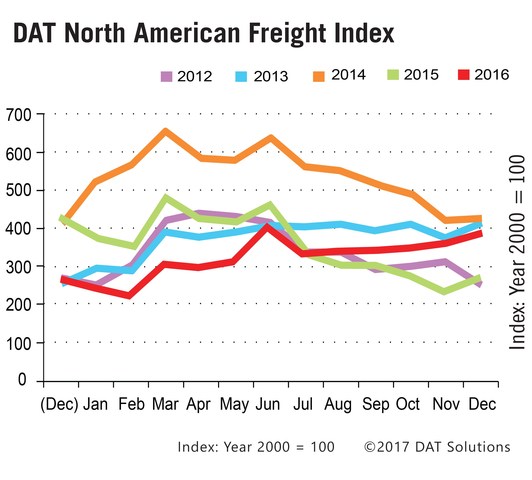
PORTLAND, Ore. - The DAT North American Freight Index rose 8 percent in December, capping off an extraordinarily strong month for spot truckload freight and six straight months of increased volume, said DAT Solutions, which operates the largest trucking load board network.
E-commerce and grocery items were major sources of December freight for what is usually a quiet period on the spot market.
Van Rates, Volumes Increase
“Van rates and volumes shot up in places like Memphis and Columbus, both associated with e-commerce fulfillment, and even Denver and Seattle exhibited unusually robust rates and shipping patterns,” said Mark Montague, DAT industry analyst.
Van freight availability increased 10 percent compared to November and surged 52 percent year over year, for an average van load-to-truck ratio of 3.8, a 22-percent increase compared to November and 80 percent higher year over year. The load-to-truck ratio measures the number of available loads for each truck posted on the DAT Network of load boards, and a change in the ratio often signals impending changes in rates.
The national average spot truckload rate for vans was $1.73 per mile including a fuel surcharge. The average rate was the highest for the year, up 7 cents month over month and 1 cent compared to December 2015.
Reefer Freight Availability Highest in 21 Months
Reefer freight availability increased 10 percent in December compared to November, primarily due to demand for fresh and frozen foods at Christmas. The reefer load-to-truck ratio of 8.2 was the highest monthly ratio in the past 21 months. Compared to December 2015, reefer volume was up 55 percent in December.
The national average spot market rate was $1.98 per mile for reefers, up 2 cents from November to December and equal to the June peak season average. Compared to December 2015, the average rate was 2 cents per mile higher.
Demand for flatbed trucks increased 2.3 percent compared to November and 48 percent compared to December 2015. Flatbed rates increased 5 cents compared to November, to $1.95 per mile. That national average was up 1 cent compared to December 2015.
Strong Second Half Makes Up for Weak Start
Despite a strong second half of 2016, spot market freight volume for the entire year fell 7.7 percent compared to 2015.
“While overall demand for truckload capacity grew 23 percent in the second half of 2016, those gains were more than offset by a 29 percent decline during the first half,” Montague said.
Established in 1978, DAT operates a network of load boards serving intermediaries and carriers across North America. For more than a decade DAT has published its Freight Index, which is representative of the dynamic spot market.
Reference rates are the averages, by equipment type, based on $28 billion of actual transactions between freight brokers and carriers, as recorded in DAT RateView. Rates are cited in this report are the average total rate per mile paid to the carrier, including the line haul plus the fuel surcharge. Beginning in January 2015, the DAT Freight Index was rebased so that 100 on the Index represents the average monthly volume in the year 2000. Additional trends and analysis are available at DAT Trendlines.
More International Trade
U.S. Cargo and Passenger Airlines Gained 760 Jobs in February 2024; Employment Remains 5.7% Above Pre-Pandemic February 2020