Cargo Throughput Grows for the First Time in the Current Business Year - Passenger Traffic Impacted by Special Effects
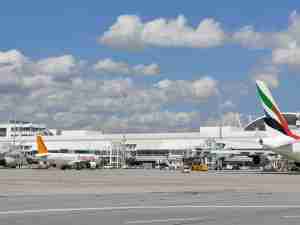
With almost five million passengers served in April 2016, Frankfurt Airport (FRA) saw passenger figures decline by 2.5 percent compared to the same period of the previous year. FRA’s traffic performance was distorted by a number of special and base-year effects, including a public sector strike on April 27, the closure of Brussels Airport and the earlier timing of the Easter holidays, with some travelers already departing in March instead of April, as in the previous year. However, even without these effects, passenger figures would have declined by about 1.5 percent in April 2016. This was largely the result of restrained holiday bookings in the wake of the Brussels terrorist attacks as well as reflecting holidaymakers’ concerns about the security situation at various travel destinations.
In marked contrast to passenger traffic, cargo (airfreight + airmail) volumes experienced strong growth, soaring by 5.0 percent to 181,948 metric tons. Far East traffic was the main growth driver, with cargo tonnage to/from this region climbing by 9.0 percent. Freight volumes on routes to/from China, Japan, and India even recorded dynamic double-digit growth. While cargo throughput declined during the first three months of 2016, cumulative cargo volumes in the year to April reached positive territory again for the first time, growing by 0.5 percent. Despite the strike on April 27, maximum takeoff weights (MTOWs) rose by 0.2 percent to 2.48 million metric tons, thus even exceeding the previous April record achieved last year. With some 39,000 takeoffs and landings, aircraft movements decreased by 2.1 percent.
In the reporting month, Fraport AG’s international portfolio of airports continued to develop in two different directions. Lima Airport (LIM) in Peru achieved strong passenger growth again, welcoming almost 1.4 million passengers in April 2016 - an increase of 7.1 percent. Traffic also advanced at Xi’an Airport (XIY) in central China, rising by 8.8 percent to almost 3 million passengers. Combined, the two Twin Star airports on the Bulgarian Black Sea coast - Varna (VAR) and Burgas (BOJ) - also saw traffic rise by 11.6 percent to 57,498 passengers in the month of April. By contrast, passenger numbers at Antalya Airport (AYT) in Turkey and Pulkovo Airport (LED) in St. Petersburg, Russia, declined again by 22.8 percent to 1.2 million passengers and 3.5 percent to 900,541 passengers, respectively. Hanover Airport (HAJ) in northern Germany also recorded a 4.4 percent drop to 415,047 passengers. At Ljubljana Airport (LJU) in Slovenia, traffic fell by 10.5 percent to 100,549 passengers year-on-year.

Fraport Traffic Figures April 2016 Fraport Group Airports[1] Cargo (Freight & April 2016 Fraport Passengers Mail) Movements share DELTA DELTA DELTA in % Month % Month % Month % Fully-consolidated airports Frankfurt, FRA Germany 100.00 4,933,724 -2.5 178,305 4.7 39,009 -2.1 Ljubljana, LJU Slovenia 100.00 100,549 -10.5 851 2.3 2,601 -3.4 LIM Lima, Peru[2] 70.01 1,384,937 7.1 20,698 -6.1 14,031 8.8 BOJ Burgas, Bulgaria 60.00 20,245 14.9 1,443 50.0 312 -4.0 VAR Varna, Bulgaria 60.00 37,253 9.8 25 >100 519 23.9 At equity consolidated airports[2] AYT Antalya, Turkey 51.00 1,237,669 -22.8 n.a. n.a. 8,718 -25.6 St. Petersburg, LED Russia 35.50 900,541 -3.5 n.a. n.a. 9,851 -7.8 HAJ Hanover, Germany 30.00 415,047 -4.4 2,128 55.8 6,508 1.1 XIY Xi'an, China 24.50 2,979,483 8.8 18,504 10.5 23,259 6.6 Fraport Group Airports[1] Cargo (Freight & Year to Date (YTD) 2016 Fraport Passengers Mail) Movements share DELTA DELTA DELTA in % YTD % YTD % YTD % Fully-consolidated airports Frankfurt, FRA Germany 100.00 17,859,466 1.7 675,070 0.3 144,853 0.1 Ljubljana, LJU Slovenia 100.00 346,015 -0.7 3,267 4.4 9,026 -3.2 LIM Lima, Peru[2] 70.01 5,864,586 10.3 81,846 -5.7 56,582 9.4 BOJ Burgas, Bulgaria 60.00 54,777 15.2 4,573 97.1 1,018 16.3 VAR Varna, Bulgaria 60.00 119,801 18.8 45 66.2 1,627 18.8 At equity consolidated airports[2] AYT Antalya, Turkey 51.00 3,589,503 -10.8 n.a. n.a. 25,518 -15.1 St. Petersburg, LED Russia 35.00 3,215,017 -5.5 n.a. n.a. 35,543 -13.7 HAJ Hanover, Germany 30.00 1,423,050 1.0 6,819 9.0 22,473 2.0 XIY Xi'an, China 24.50 11,575,477 11.9 73,230 14.6 92,126 10.0 Frankfurt Airport[3] YTD DELTA April 2016 Month DELTA % 2016 % Passengers 4,934,090 -2.5 17,860,781 1.6 Cargo (freight & mail) 181,948 5.0 688,383 0.5 Aircraft movements 39,009 -2.1 144,853 0.1 MTOW (in metric tons)[4] 2,481,041 0.2 9,341,601 2.5 PAX/PAX-flight[5] 135.7 -0.2 132.5 1.3 Seat load factor (%) 74.4 72.5 Punctuality rate (%) 84.0 83.6 PAX PAX share Month share YTD Frankfurt Airport Regional Split month DELTA % YTD DELTA% Continental 62.9% -3.8 60.5% 1.2 Germany 12.0% 1.6 11.9% 1.9 Europe (without Germany) 50.8% -5.0 48.6% 1.0 Western Europe 42.4% -5.0 40.6% 1.3 Eastern Europe 8.4% -4.9 8.0% -0.6 Intercontinental 37.1% -0.1 39.5% 2.5 Africa 3.9% -8.0 4.3% 0.5 Middle East 5.8% 4.3 6.3% 4.8 North America 12.3% -1.0 12.3% 2.9 Central & South America 3.9% 9.5 4.6% 8.7 Far East 11.2% -1.2 12.0% -0.5 Australia 0.0% 0.0 0.0% 0.0[1] According to ACI-definition: Passengers: commercial traffic only (arr+dep+transit counted once) Cargo: commercial and non-commercial traffic (arr+dep excluding transit, in metric tons) Movements: commerical and non-commercial traffic (arr+dep) [2] Preliminary figures [3] Passengers: commercial and non-commercial traffic (arr+dep+transit counted once incl. General Aviation) Cargo: commercial and non-commercial traffic (arr+dep+transit counted once, in metric tons) Movements: commerical and non-commercial traffic (arr+dep) [4] Inbound traffic only [5] Scheduled and charter traffic