- US airports are experiencing significant congestion in the run-up to Christmas, affecting both domestic and international freight movements.
- In Europe, air cargo hit capacity two weeks ago and hasn’t yet pulled back. Heathrow is experiencing severe backlogs. And now, bad weather has hit some European airports, including Zurich, Schiphol and Frankfurt.
- Airlines aren’t expecting congestion to abate and prices to return to normal until 15 January…just in time to start heating up again, with shipments vying to get out of port before the Chinese New Year shutdown.
- Air freight congestion appears to have encouraged frustrated shippers to switch mode to sea, where there are no capacity issues to speak of.
TRADE LANE
|
THIS WEEK
|
LAST WEEK
|
WOW CHANGE
|
THIS WEEK (2016)
|
YOY CHANGE
|
China-US West Coast
|
$1,012
|
$962
|
5%
|
$1,365
|
-26%
|
China-US East Coast
|
$1,769
|
$1,613
|
10%
|
$2,349
|
-25%
|
China-Europe
|
$1,380
|
$1,325
|
4%
|
$1,695
|
-19%
|
Europe-US East Coast
|
$1,102
|
$1,127
|
-2%
|
$1,480
|
-26%
|
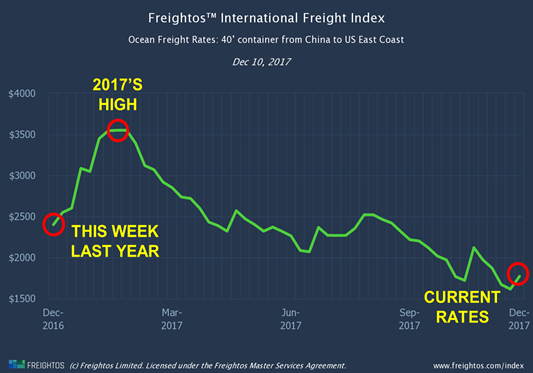
- China-US West Coast rates rose slightly (5%), but are still 26% behind last year’s rates.
- China-US East Coast rates also rose (10%), but are still 25% behind last year’s rates.
- China-Europe rates have been relatively stable recently. In the process, they are catching up on rates this time last year, from being 25% behind two weeks ago to only being 19% behind last week.
- Europe-US East Coast rates dropped again for the fourth straight week, lane, and are now a full 30% lower than last year’s rates and slightly less than half this year’s high ($3,549 in W5 and W6).