| YEAR | FULL IMPORT | FULL EXPORT | EMPTY IMPORT | EMPTY EXPORT | Grand Total | Trend* |
| 1990 | 253864 | 600595 | 218366 | 51298 | 1124123 | 0.031 |
| 1991 | 286696 | 630557 | 228789 | 48676 | 1194718 | 0.063 |
| 1992 | 354490 | 656674 | 205737 | 74593 | 1291494 | 0.081 |
| 1993 | 365114 | 667879 | 202866 | 69275 | 1305134 | 0.011 |
| 1994 | 403845 | 764237 | 249625 | 73295 | 1491002 | 0.142 |
| 1995 | 404842 | 809894 | 266506 | 68644 | 1549886 | 0.039 |
| 1996 | 360717 | 782913 | 283314 | 71258 | 1498202 | -0.033 |
| 1997 | 398157 | 769172 | 288304 | 75555 | 1531188 | 0.022 |
| 1998 | 458470 | 747064 | 237176 | 132696 | 1575406 | 0.029 |
| 1999 | 469226 | 789873 | 234121 | 170536 | 1663756 | 0.056 |
| 2000 | 503858 | 818521 | 244359 | 210184 | 1776922 | 0.068 |
| 2001 | 486389 | 758958 | 223894 | 174344 | 1643585 | -0.075 |
| 2002 | 547230 | 732537 | 206418 | 221642 | 1707827 | 0.039 |
| 2003 | 599411 | 799547 | 206267 | 317879 | 1923104 | 0.126 |
| 2004 | 694314 | 813716 | 184863 | 354611 | 2047504 | 0.065 |
| 2005 | 836258 | 846579 | 197988 | 393165 | 2273990 | 0.111 |
| 2006 | 877778 | 840145 | 192455 | 481367 | 2391745 | 0.052 |
| 2007 | 870284 | 909633 | 204943 | 403051 | 2387911 | -0.002 |
| 2008 | 796404 | 910700 | 192569 | 333860 | 2233533 | -0.065 |
| 2009 | 701501 | 966882 | 209258 | 167570 | 2045211 | -0.084 |
| 2010 | 802657 | 955579 | 209878 | 362343 | 2330457 | 0.139 |
| 2011 | 797272 | 993826 | 264471 | 286957 | 2342526 | 0.005 |
| 2012 | 791672 | 986452 | 271068 | 294711 | 2343903 | 0.001 |
| 2013 | 803314 | 1014796 | 270535 | 257919 | 2346564 | 0.001 |
| 2014 | 845810 | 969378 | 254636 | 324245 | 2394069 | 0.02 |
Import volume up for seventh straight month at Port of Oakland
posted by AJOT | Oct 12 2015 at 11:07 AM | Ports & Terminals
Early-2015 decline erased in September
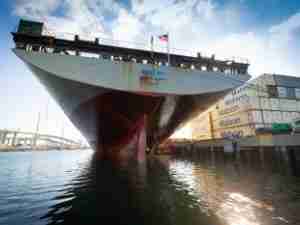
Oakland, Calif. - Containerized import volume was up for a seventh-straight month at the Port of Oakland in September. The Port said today that it handled 1.6 percent more containerized imports last month than it did a year ago.
The import rally has erased a wintertime decline in Oakland. The Port said import totals for the first nine months of 2015 are now even with last year. That’s a significant turnaround from January and February when import volume dropped nearly 40 percent.
“We’re pleased with the ongoing buildup of import cargo,” said Maritime Director John Driscoll. “Our job now is to maintain the momentum.”
Overall containerized cargo volume – imports, exports and empty containers – declined 4.8 percent in September, the Port said. A 12.6 percent drop in exports contributed to the decrease. The Port said two factors dampened export volume:
Continued strength in the U.S. dollar which makes American goods more expensive overseas; and
The economic slowdown in China which has curbed its demand for foreign commodities.
* Denotes change versus same time period from previous year.