HONOLULU - Matson, Inc. (“Matson” or the “Company”) (NYSE: MATX), a leading U.S. carrier in the Pacific, today reported net income of
$24.0 million, or
$0.55 per diluted share for the quarter ended
June 30, 2017. Net income for the quarter ended
June 30, 2016 was
$18.0 million, or
$0.42 per diluted share. Consolidated revenue for the second quarter 2017 was
$512.5 million compared with
$467.7 million reported for the second quarter 2016.
For the six months ended
June 30, 2017, Matson reported net income of
$31.0 million, or
$0.72 per diluted share compared with
$36.1 million, or
$0.83 per diluted share in 2016. Consolidated revenue for the six month period ended
June 30, 2017 was
$986.9 million, compared with
$921.9 million in 2016.
Matt Cox, Matson’s Chairman and Chief Executive Officer, commented, “Matson achieved better than expected second quarter results, buoyed by stronger demand for our expedited
China service, the timing of fuel surcharge collections, higher lift volumes at our SSAT terminal joint venture, and improved performance in Logistics. However, these gains were moderated by lower construction related cargo to
Hawaii as the boom of high-rise condominium developments in
Honolulu has begun to ebb and other real estate construction activity has yet to offset that decline.”
Mr. Cox added, “For the balance of 2017, we continue to expect modest improvement in each of our core tradelanes with the exception of
Guam where we expect further competitive losses due to the launch of a competitor’s weekly service in December 2016. As a result, we are affirming our 2017 outlook for operating income and EBITDA; and consequently, we continue to expect operating income to be lower than it was in 2016 and EBITDA to approximate the level achieved in 2016.”
Second Quarter 2017 Discussion and Outlook for Second Half 2017
Ocean Transportation: The
Hawaii economy experienced modest growth in the second quarter 2017; however, the Company’s container volume was lower due to the absence of volume gains associated with a competitor’s service reconfiguration and related issues in the second quarter of 2016, and lower construction related volumes. Given the timing of the expected transition of construction activity and the absence of a 53
rd week in 2017, the Company expects its full year 2017 Hawaii container volume to be modestly lower than the level achieved in 2016.
In
China, the Company’s container volume in the second quarter 2017 was 15.0 percent higher year-over-year due to stronger demand for Matson’s expedited service and an additional sailing. The Company continued to realize a sizeable rate premium in the second quarter 2017 and achieved average freight rates modestly higher than the second quarter 2016. For the remainder of 2017, the Company expects continued strong demand for our highly differentiated expedited service amid a chronically over-supplied international container shipping market.
In
Guam, as expected, the Company’s container volume in the second quarter 2017 was lower on a year-over-year basis, the result of competitive losses to a U.S. flagged containership service that increased its service frequency to weekly in December 2016. For the balance of 2017, the Company expects a continued heightened competitive environment and lower volume.
In
Alaska, the Company’s container volume for the second quarter 2017 was 1.1 percent lower year-over-year, primarily the result of the continued energy sector related economic contraction, partially offset by improved seafood harvest. For the remainder of 2017, the Company continues to expect modestly lower volume based on declining northbound freight due to ongoing contraction of
Alaska’s energy-based economy, partially offset by improved southbound seafood volume.
As a result, the Company expects Ocean Transportation operating income for the full year 2017 to be lower than the
$141.3 million achieved in 2016. In the third quarter 2017, the Company expects Ocean Transportation operating income to be moderately higher than the
$42.7 million achieved in the third quarter 2016.
Logistics: In the second quarter 2017, operating income for the Company’s Logistics segment included a full quarter of freight forwarding operating results from its acquired Span Alaska business. For the full year 2017, the Company expects Logistics operating income to be approximately
$20 million, up significantly from the 2016 level of
$11.9 million, primarily due to the inclusion of Span Alaska’s freight forwarding business for a full year. In the third quarter 2017, the Company expects Logistics operating income to be approximately double the
$3.5 million achieved in the third quarter 2016.
Depreciation and Amortization: For the full year 2017, the Company expects depreciation and amortization expense to increase by approximately
$15 million to $150 million, inclusive of dry-docking amortization of approximately
$50 million, primarily due to the higher levels of maintenance capital and vessel dry-docking expenditures in 2016 and planned for the remainder of 2017.
EBITDA: The Company expects full year 2017 EBITDA to approximate the
$288.6 million achieved in 2016.
Interest Expense: The Company expects interest expense for the full year 2017 to be approximately
$25 million.
Income Tax Expense: In the second quarter 2017, the Company’s effective tax rate was 39.4 percent. For the full year 2017, the Company expects its effective tax rate to be approximately 39 percent.
Capital and Vessel Dry-docking Expenditures: In the second quarter 2017, the Company made maintenance capital expenditure payments of
$14.2 million, vessel construction expenditures of
$44.9 million, and dry-docking payments of
$17.9 million. For the full year 2017, the Company expects to make maintenance capital expenditure payments of approximately
$50 million, vessel construction expenditures of approximately
$242 million, and dry-docking payments of approximately
$50 million.
| Results By Segment
Ocean Transportation — Three months ended June 30, 2017 compared with 2016
|
| |
|
|
|
|
|
|
|
|
|
|
|
|
| |
|
Three Months Ended June 30,
|
|
| (Dollars in millions)
|
|
2017
|
|
2016
|
|
Change
|
|
| Ocean Transportation revenue
|
|
$
|
392.7
|
|
$
|
370.9
|
|
$
|
21.8
|
|
5.9
|
%
|
| Operating costs and expenses
|
|
|
(353.7)
|
|
|
(337.0)
|
|
|
(16.7)
|
|
5.0
|
%
|
| Operating income
|
|
$
|
39.0
|
|
$
|
33.9
|
|
$
|
5.1
|
|
15.0
|
%
|
| Operating income margin
|
|
|
9.9
|
%
|
|
9.1
|
%
|
|
|
|
|
|
| |
|
|
|
|
|
|
|
|
|
|
|
|
| Volume (Forty-foot equivalent units (FEU), except for automobiles) (1)
|
|
|
|
|
|
|
|
|
|
|
|
|
| Hawaii containers
|
|
|
38,600
|
|
|
39,700
|
|
|
(1,100)
|
|
(2.8)
|
%
|
| Hawaii automobiles
|
|
|
16,500
|
|
|
21,200
|
|
|
(4,700)
|
|
(22.2)
|
%
|
| Alaska containers
|
|
|
17,500
|
|
|
17,700
|
|
|
(200)
|
|
(1.1)
|
%
|
| China containers
|
|
|
16,900
|
|
|
14,700
|
|
|
2,200
|
|
15.0
|
%
|
| Guam containers
|
|
|
5,400
|
|
|
6,300
|
|
|
(900)
|
|
(14.3)
|
%
|
| Micronesia/South Pacific containers
|
|
|
2,500
|
|
|
2,100
|
|
|
400
|
|
19.0
|
%
|
| ____________________
|
| (1)
|
Approximate volumes included for the period are based on the voyage departure date, but revenue and operating income are adjusted to reflect the percentage of revenue and operating income earned during the reporting period for voyages in transit at the end of each reporting period.
|
Ocean Transportation revenue increased
$21.8 million, or 5.9 percent, during the three months ended
June 30, 2017, compared with the three months ended
June 30, 2016. This increase was primarily due to higher fuel surcharge revenue, higher average freight rates in
China and
Hawaii, and higher container volume in
China, partially offset by lower volume in
Hawaii and
Guam.
On a year-over-year FEU basis,
Hawaii container volume decreased by 2.8 percent due to the absence of competitive volume gains in the prior year and a modest market contraction;
Alaska volume decreased by 1.1 percent attributable to the continued energy sector related economic contraction;
China volume was 15.0 percent higher due to stronger demand for the Company’s expedited service and an additional sailing during the three months ended
June 30, 2017; and
Guam volume was 14.3 percent lower due to competitive losses.
Ocean Transportation operating income increased
$5.1 million, or 15.0 percent, during the three months ended
June 30, 2017, compared with the three months ended
June 30, 2016. The increase was primarily due to higher average freight rates and container volume in
China, favorable timing of fuel surcharge collections, higher contribution from SSAT, and higher freight rates in Hawaii. Partially offsetting these favorable year-over-year comparisons were higher terminal handling expenses, higher vessel dry-docking amortization expense, and lower container volume in
Hawaii and
Guam.
The Company’s SSAT terminal joint venture investment contributed
$6.9 million during the three months ended
June 30, 2017, compared to a
$3.0 million contribution during the three months ended
June 30, 2016. The increase was primarily attributable to improved lift volume.
| Ocean Transportation — Six months ended June 30, 2017 compared with 2016
|
| |
|
|
|
|
|
|
|
|
|
|
|
|
| |
|
Six Months Ended June 30,
|
|
| (Dollars in millions)
|
|
2017
|
|
2016
|
|
Change
|
|
| Ocean Transportation revenue
|
|
$
|
762.7
|
|
$
|
737.0
|
|
$
|
25.7
|
|
3.5
|
%
|
| Operating costs and expenses
|
|
|
(709.2)
|
|
|
(670.1)
|
|
|
(39.1)
|
|
5.8
|
%
|
| Operating income
|
|
$
|
53.5
|
|
$
|
66.9
|
|
$
|
(13.4)
|
|
(20.0)
|
%
|
| Operating income margin
|
|
|
7.0
|
%
|
|
9.1
|
%
|
|
|
|
|
|
| |
|
|
|
|
|
|
|
|
|
|
|
|
| Volume (Forty-foot equivalent units (FEU), except for automobiles) (1)
|
|
|
|
|
|
|
|
|
|
|
|
|
| Hawaii containers
|
|
|
75,000
|
|
|
78,200
|
|
|
(3,200)
|
|
(4.1)
|
%
|
| Hawaii automobiles
|
|
|
30,300
|
|
|
38,500
|
|
|
(8,200)
|
|
(21.3)
|
%
|
| Alaska containers
|
|
|
33,300
|
|
|
34,200
|
|
|
(900)
|
|
(2.6)
|
%
|
| China containers
|
|
|
32,200
|
|
|
27,100
|
|
|
5,100
|
|
18.8
|
%
|
| Guam containers
|
|
|
10,800
|
|
|
12,100
|
|
|
(1,300)
|
|
(10.7)
|
%
|
| Micronesia/South Pacific containers
|
|
|
4,600
|
|
|
4,200
|
|
|
400
|
|
9.5
|
%
|
| ____________________
|
| (1)
|
Approximate volumes included for the period are based on the voyage departure date, but revenue and operating income are adjusted to reflect the percentage of revenue and operating income earned during the reporting period for voyages in transit at the end of each reporting period.
|
Ocean Transportation revenue increased
$25.7 million, or 3.5 percent, during the six months ended
June 30, 2017, compared with the six months ended
June 30, 2016. This increase was primarily due to higher fuel surcharge revenue, higher container volume in
China, and higher average freight rates in
China and
Hawaii, partially offset by lower volume in
Hawaii,
Guam and
Alaska.
On a year-over-year FEU basis,
Hawaii container volume decreased by 4.1 percent primarily due to the absence of competitive volume gains in the prior year;
Alaska volume decreased by 2.6 percent attributable to the continued energy sector related economic contraction;
China volume was 18.8 percent higher due to stronger demand for the Company’s expedited service and additional sailings during the first half 2017; and
Guam volume was 10.7 percent lower due to competitive losses.
Ocean Transportation operating income decreased
$13.4 million, or 20.0 percent, during the six months ended
June 30, 2017, compared with the six months ended
June 30, 2016. The decrease was primarily due to higher terminal handling costs, higher vessel dry-docking amortization expense, and lower container volume in
Hawaii and Guam. Partially offsetting these unfavorable year-over-year comparisons were higher container volume and average freight rates in
China, and higher contribution from SSAT.
The Company’s SSAT terminal joint venture investment contributed
$11.8 million during the six months ended
June 30, 2017, compared to a
$5.6 million contribution in the six months ended
June 30, 2016. The increase was primarily attributable to improved lift volume.
| Logistics — Three months ended June 30, 2017 compared with 2016
|
| |
|
|
|
|
|
|
|
|
|
|
|
|
| |
|
Three Months Ended June 30,
|
|
| (Dollars in millions)
|
|
2017
|
|
2016
|
|
Change
|
|
| Logistics revenue (1)
|
|
$
|
119.8
|
|
$
|
96.8
|
|
$
|
23.0
|
|
23.8
|
%
|
| Operating costs and expenses (1)
|
|
|
(112.9)
|
|
|
(94.6)
|
|
|
(18.3)
|
|
19.3
|
%
|
| Operating income (1)
|
|
$
|
6.9
|
|
$
|
2.2
|
|
$
|
4.7
|
|
213.6
|
%
|
| Operating income margin (1)
|
|
|
5.8
|
%
|
|
2.3
|
%
|
|
|
|
|
|
| ____________________
|
| (1)
|
Logistics operating results include Span Alaska operating results from the date of acquisition on August 4, 2016.
|
Logistics revenue increased
$23.0 million, or 23.8 percent, during the three months ended
June 30, 2017, compared with the three months ended
June 30, 2016. This increase was primarily due to the inclusion of freight forwarding revenue from the acquired Span Alaska business and higher fuel surcharge revenue in transportation brokerage services.
Logistics operating income increased
$4.7 million during the three months ended
June 30, 2017, compared with the three months ended
June 30, 2016. The increase was primarily due to the inclusion of freight forwarding operating results attributable to the acquired Span Alaska business.
| Logistics — Six months ended June 30, 2017 compared with 2016
|
| |
|
|
|
|
|
|
|
|
|
|
|
|
| |
|
Six Months Ended June 30,
|
|
| (Dollars in millions)
|
|
2017
|
|
2016
|
|
Change
|
|
| Logistics revenue (1)
|
|
$
|
224.2
|
|
$
|
184.9
|
|
$
|
39.3
|
|
21.3
|
%
|
| Operating costs and expenses (1)
|
|
|
(215.4)
|
|
|
(181.1)
|
|
|
(34.3)
|
|
18.9
|
%
|
| Operating income (1)
|
|
$
|
8.8
|
|
$
|
3.8
|
|
$
|
5.0
|
|
131.6
|
%
|
| Operating income margin (1)
|
|
|
3.9
|
%
|
|
2.1
|
%
|
|
|
|
|
|
| ____________________
|
| (1)
|
Logistics operating results include Span Alaska operating results from the date of acquisition on August 4, 2016.
|
Logistics revenue increased
$39.3 million, or 21.3 percent, during the six months ended
June 30, 2017, compared to the six months ended
June 30, 2016. This increase was primarily due to the inclusion of freight forwarding revenue from the acquired Span Alaska business, higher fuel surcharge revenue in transportation brokerage services, and higher intermodal volume.
Logistics operating income increased
$5.0 million during the six months ended
June 30, 2017, compared to the six months ended
June 30, 2016. The increase was primarily due to the inclusion of freight forwarding operating results attributable to the acquired Span Alaska business and higher intermodal volume, partially offset by lower intermodal yield.
Liquidity, Cash Flows and Capital Allocation
Matson’s Cash and Cash Equivalents increased by
$1.4 million to
$15.3 million during the six months ended
June 30, 2017. Matson generated net cash from operating activities of
$63.4 million during the six months ended
June 30, 2017, compared to
$78.8 million in the six months ended
June 30, 2016. Capital expenditures, including vessel construction expenditures totaled
$83.3 million for the six months ended
June 30, 2017, compared with
$65.8 million in the six months ended
June 30, 2016. Total debt increased by
$15.0 million during the first half 2017 to
$753.9 million as of
June 30, 2017, of which
$722.6 million was long-term debt.
For the twelve months ended
June 30, 2017, Matson’s Net Income and EBITDA were
$75.4 million and
$290.7 million, respectively. The ratio of Matson’s Net Debt to last twelve months EBITDA was 2.5 as of
June 30, 2017.
On
June 29, 2017, Matson entered into amendments to its existing unsecured revolving credit facility and long-term private note agreements. The Company’s existing
$400 million unsecured revolving credit facility was increased to
$650 million and extended for a new five-year term, maturing June 2022. In addition, the facility includes a number of amended terms, including modifications to certain definitions and covenants. Matson also entered into a number of amendments to its existing long-term private note agreements, including modifications to certain definitions and covenants. In particular, the consolidated leverage ratio covenant has been amended to provide for additional covenant flexibility during Matson’s new vessel construction period.
As previously announced, Matson’s Board of Directors declared a cash dividend of
$0.20 per share payable on
September 7, 2017 to all shareholders of record as of the close of business on
August 3, 2017.
Teleconference and Webcast
A conference call is scheduled today at
4:30 p.m. EDT when
Matt Cox, Chairman and Chief Executive Officer, and
Joel Wine, Senior Vice President and Chief Financial Officer, will discuss Matson’s second quarter 2017 results.
| Date of Conference Call:
|
Monday, July 31, 2017
|
| |
|
| Scheduled Time:
|
4:30 p.m. EDT / 1:30 p.m. PDT / 10:30 a.m. HST
|
| |
|
| Participant Toll Free Dial In #:
|
1-877-312-5524
|
| |
|
| International Dial In #:
|
1-253-237-1144
|
The conference call will be broadcast live along with a slide presentation on the Company’s website at
www.matson.com; Investor Relations. A replay of the conference call will be available approximately two hours after the call through
August 8, 2017 by dialing 1-855-859-2056 or 1-404-537-3406 and using the conference number 32755603. The slides and audio webcast of the conference call will be archived for one full quarter on the Company’s Investor Relations page of the Matson website.
About the Company
Founded in 1882, Matson (NYSE: MATX) is a leading U.S. carrier in the Pacific. Matson provides a vital lifeline to the economies of
Hawaii,
Alaska,
Guam,
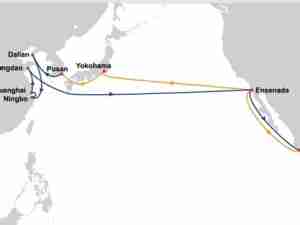
Micronesia and select South Pacific islands, and operates a premium, expedited service from
China to Southern California. The Company’s fleet of 21 owned vessels and six chartered vessels includes containerships, combination container and roll-on/roll-off ships and custom-designed barges. Matson Logistics, established in 1987, extends the geographic reach of Matson’s transportation network throughout the continental U.S. Its integrated, asset-light logistics services include rail intermodal, highway brokerage, warehousing, and less-than-container load freight consolidation and forwarding to Alaska. Additional information about the Company is available at
www.matson.com.
GAAP to Non-GAAP Reconciliation
This press release, the Form 8-K and the information to be discussed in the conference call include non-GAAP measures. While Matson reports financial results in accordance with U.S. generally accepted accounting principles (“GAAP”), the Company also considers other non-GAAP measures to evaluate performance, make day-to-day operating decisions, help investors understand our ability to incur and service debt and to make capital expenditures, and to understand period-over-period operating results separate and apart from items that may, or could, have a disproportional positive or negative impact on results in any particular period. These non-GAAP measures include, but are not limited to, Earnings Before Interest, Depreciation and Amortization (“EBITDA”) and Net Debt/EBITDA.
Forward-Looking Statements
Statements in this news release that are not historical facts are “forward-looking statements,” within the meaning of the Private Securities Litigation Reform Act of 1995, including without limitation those statements regarding earnings, operating income, profitability and cash flow expectations, fleet renewal progress, fleet deployments, economic effects of competitors’ services, expenses, rate premiums and market conditions in the
China service, trends in volumes, economic growth and construction activity in
Hawaii, economic conditions in
Alaska, vessel deployments and operating efficiencies, and effective tax rates. These statements involve a number of risks and uncertainties that could cause actual results to differ materially from those contemplated by the relevant forward-looking statement, including but not limited to risks and uncertainties relating to regional, national and international economic conditions; new or increased competition or improvements in competitors’ service levels; fuel prices and our ability to collect fuel surcharges; our relationship with vendors, customers and partners and changes in related agreements; the actions of our competitors; our ability to offer a differentiated service in
China for which customers are willing to pay a significant premium; the imposition of tariffs or a change in international trade policies; the ability of the shipyards to construct and deliver the Aloha Class and Kanaloa Class vessels on the contemplated timeframes; any unanticipated dry-dock expenses; consummating and integrating acquisitions; changes in general economic and/or industry-specific conditions; competition and growth rates within the logistics industry; freight levels and increasing costs and availability of truck capacity or alternative means of transporting freight; changes in relationships with existing truck, rail, ocean and air carriers; changes in customer base due to possible consolidation among customers; conditions in the financial markets; changes in our credit profile and our future financial performance; our ability to obtain future debt financings; continuation of the Title XI and CCF programs; the timing, amount and manner of share repurchases and the ability to return capital to shareholders through the share repurchase program; the impact of future and pending legislation, including environmental legislation; government regulations and investigations; repeal, substantial amendment or waiver of the Jones Act or its application, or our failure to maintain our status as a
United States citizen under the Jones Act; relations with our unions; satisfactory negotiation and renewal of expired collective bargaining agreements without significant disruption to Matson’s operations; and the occurrence of marine accidents, poor weather or natural disasters. These forward-looking statements are not guarantees of future performance. This release should be read in conjunction with our Annual Report on Form 10-K and our other filings with the SEC through the date of this release, which identify important factors that could affect the forward-looking statements in this release. We do not undertake any obligation to update our forward-loo