February volume total behind record-setting month in 2016
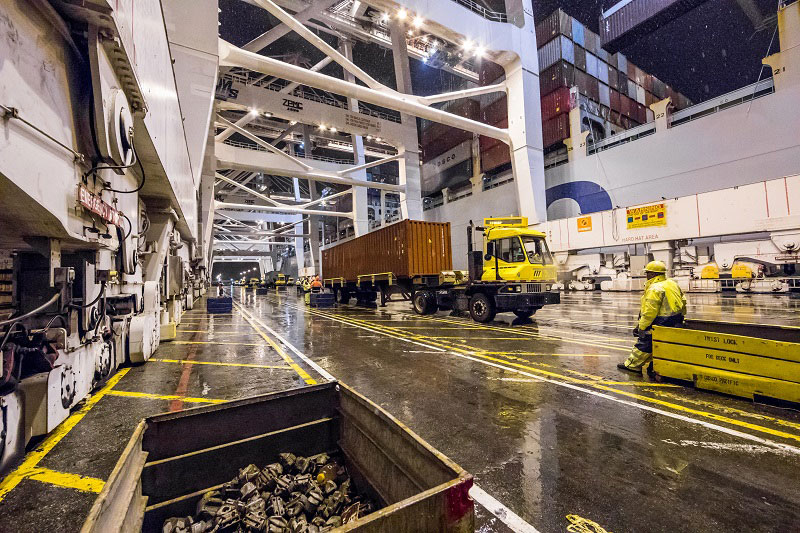
Dockworkers move containers at the Port of Long Beach's Pier J in February 2017.Reduced economic activity in Asia associated with the Lunar New Year contributed to lower February container volumes at the Port of Long Beach. Overall, traffic totaled 498,311 twenty-foot equivalent units (TEUs), a decline of 11.2 percent compared to the same month last year, the highest-volume February in Port history. Cargo in February 2015 ballooned 35.9 percent year-over-year.
The Lunar New Year holiday began Jan. 28, almost two weeks earlier than in 2016. The Lunar New Year typically results in slower trade since businesses in China — the world’s No. 2 economy and the Port’s primary trading partner — close for a week or more to observe the holiday. The impact on the Port is seen two weeks afterwards, accounting for the time it takes vessels to cross the Pacific.
Import containers were down 15.6 percent in February to 249,759 TEUs. Exports were slightly lower, 119,811 TEUs, off 2.6 percent. Empty containers sent from Long Beach docks totaled 128,742 TEUs, a decrease of 9.7 percent.
More than 1 million containers have moved through the Port of Long Beach in the first two months of 2017.
The Port of Long Beach is one of the world’s premier seaports, a gateway for trans-Pacific trade and a trailblazer in goods movement and environmental stewardship. With 175 shipping lines connecting Long Beach to 217 seaports, the Port handles $180 billion in trade annually, supporting hundreds of thousands of Southern California jobs.
February
Fiscal Year to Date***
2017**
2016
%Change
2017***
2016
%Change
Loaded Inbound
249759
295870
-15.60%
1387669
1485012
-6.60%
Loaded Outbound
119811
123010
-2.60%
608643
608892
0.00%
Empties
128742
142532
-9.70%
749732
839825
-10.70%
TOTAL (T.E.U.)
498311
561412
-11.20%
2746044
2933729
-6.40%
More Ports & Terminals
Port of New Orleans announces $7.1 million in federal funding for sustainability infrastructure
America’s ports will reduce air pollution with $150 million in FHWA grants
Today, the American Association of Port Authorities (AAPA), joined by several port leaders at a White House event, celebrated almost $150 million in grants from the Federal Highway Administration's (FHWA)…
Great Lakes announces new $150,000,000 second-lien financing agreement
Great Lakes Dredge & Dock Corporation ("Great Lakes" or the “Company”), the largest provider of dredging services in the United States, announced that it has entered into a $150,000,000 5-year,…