Record July imports lift total volume to historic level for seaport
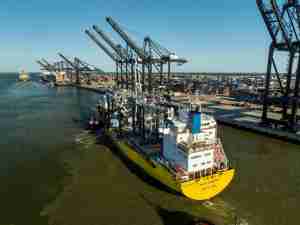
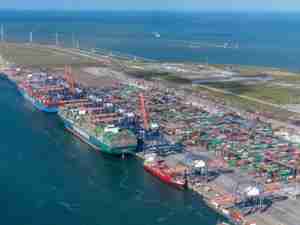
A container ship arrives at the Port of Long Beach in July 2017.Surging cargo volume in July set a record for the best month in the Port of Long Beach’s 106-year history, surpassing the previous high mark set in August 2015 for the number of containers moved across its docks. With total volume of 720,312 twenty-foot-equivalent units (TEUs) in July, cargo traffic has increased for five consecutive months in Long Beach, and in six of the first seven months of 2017. Volume is up 6.4 percent for the calendar year compared to 2016.
“Given the unprecedented change in the industry, we are pleased to see shippers choosing Long Beach,” said Harbor Commission President Lou Anne Bynum. “We thank our industry partners for having confidence in this Port, and we pledge to continue to provide the best service and the best facilities.”
“These numbers are great for Long Beach and good news for the economy,” said Port of Long Beach Executive Director Mario Cordero. “They are also indicators of the kind of service we provide to our customers as they seek the best and most efficient pathways to get their goods to U.S. markets.”
Overall, container business in Long Beach was 13.1 percent higher in July compared to the same month a year ago. Imports jumped 16.3 percent to 378,820 TEUs — also setting an all-time record for the Port — as retailers anticipate consumer demand for goods in the coming months. Exports slipped 11.7 percent to 126,098 containers. The recent wave of imports helped push empty containers 27.7 percent higher, to 215,394 TEUs. Empty containers are repositioned overseas.
The Port of Long Beach is one of the world’s premier seaports, a gateway for trans-Pacific trade and a trailblazer in goods movement and environmental stewardship. With 175 shipping lines connecting Long Beach to 217 seaports, the Port handles $180 billion in trade annually, supporting hundreds of thousands of Southern California jobs.
Container Trade in TEUs*
July
Fiscal Year to Date***
2017**
2016
%Change
2017***
2016
%Change
Loaded Inbound
378,820
325,608
16.3%
2,976,152
2,909,736
2.3%
Loaded Outbound
126,098
142,812
-11.7%
1,208,525
1,258,411
-4.0%
Empties
215,394
168,671
27.7%
1,652,088
1,590,275
3.9%
TOTAL (T.E.U.)
720,312
637,091
13.1%
5,836,765
5,758,422
1.4%
*TEUs: 20-foot equivalent units or 20-foot-long cargo container
**Preliminary estimate
The size of cargo containers range from 20 feet long to more than 50 feet long.
The international measure is the smallest box, the 20-footer or 20-foot-equivalent unit (TEU).
*** Fiscal Year = Oct. 1 through Sep. 30.
More Ports & Terminals
AAPA urges EPA to finalize proposed clean ports program buy American waiver
The American Association of Port Authorities (AAPA) recently commented in favor of the EPA’s Proposed Waiver from Build America, Buy America (BABA) rules for the $3 billion Clean Ports Program.…