| Month | Full | Empty | Grand Total | Trend* | ||||||
| Import | Trend* | Export | Trend* | Import | Trend* | Export | Trend* | |||
| January | 77,639 | 75.8% | 67,272 | 16.8% | 16,814 | -9.6% | 29,430 | 66.2% | 191,155 | 38.5% |
| February | 70,620 | 89.7% | 73,455 | 37.0% | 13,942 | -0.6% | 30,122 | 76.4% | 188,139 | 54.2% |
| March | 56,691 | -32.5% | 80,487 | 9.9% | 18,406 | -2.2% | 23,363 | -29.9% | 178,947 | -14.6% |
| April | 72,352 | -3.3% | 78,613 | 7.1% | 17,663 | 10.7% | 19,730 | -46.6% | 188,358 | -6.3% |
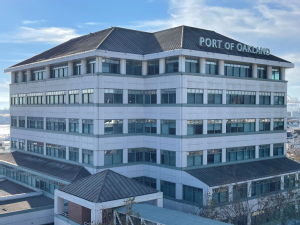
Port of Oakland export rebound now at four straight months
posted by AJOT | May 06 2016 at 11:08 AM | Ports & Terminals
Shipment volume up 7 percent in April,16 percent for the year
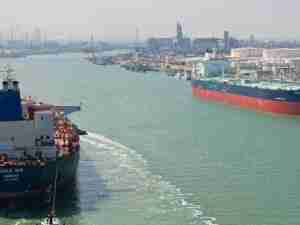
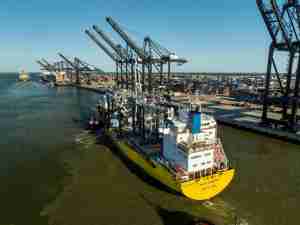
Oakland, Calif. - An export rebound continues to build steam at the Port of Oakland. The Port said today that containerized export volume increased 7 percent last month from a year ago. It was the fourth consecutive month of increases in Oakland.
The Port said that 2016 export volume is up 16.3 percent through April. That’s welcome news following a 2015 decline that saw Oakland exports drop 11.5 percent. The Port attributed export gains to a weaker dollar that makes U.S. goods more affordable overseas.
“We’re pleased to see export volume growing,” said Port Maritime Director John Driscoll. “It’s a sign that business is picking up for our customers.”
The Port said it has shipped the equivalent of 300,000 20-foot export containers so far this year. By comparison, it reported receiving the equivalent of 277,000 20-foot import boxes. The contrast reflects Oakland’s status as a leading U.S. export gateway. Most American ports handle more imports than exports.
Total cargo volume in Oakland – imports, exports and empty containers – declined 6.3 percent in April, the Port said. That was due primarily to a near 30 percent drop in empty container shipments. For the year, Oakland’s total cargo volume is up 11.3 percent.
Port of Oakland Teu’s Activity (2016)