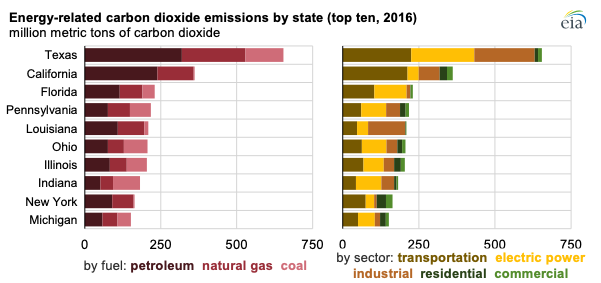
Texas has more energy-related carbon dioxide (CO2) emissions than any other state, while Vermont has the least, according to EIA’s recently released Energy-related Carbon Dioxide Emissions by State, 2005-2016. In addition to energy-related CO2 emissions estimates for all 50 states, the report provides data on CO2 emissions per capita and emissions broken out by fuel and by sector.
Population is the most important factor in determining total CO2 emissions in a state. Other factors that influence both total and per capita CO2 emissions include the state’s energy resources, climate, population density, and economic mix.
The mix of fossil fuels—natural gas, petroleum, and coal—that contribute to CO2 emissions varies by state. For example, 2 of the top 10 energy-related CO2 producing states, California (second) and New York (ninth) emit virtually no coal-related CO2 emissions, while the other 8 states in the top 10 have CO2 emissions from all three fossil fuels. Texas not only produces the most total energy-related CO2 emissions, but also has the highest emissions from coal, petroleum, and natural gas.
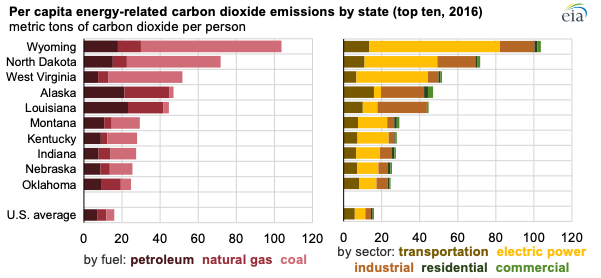
Total state CO2 emissions include those from direct fuel use across end-use sectors—residential, commercial, industrial, and transportation—and from fuels that are used in the state’s electric power sector to generate electricity. In EIA’s analysis, the emissions associated with electricity generated in a state are counted in that state, even when the electricity is exported to another state. For example, most of the electricity generated in Wyoming is sent to other states, but in this analysis, the CO2 emissions related to generating that electricity are attributed to Wyoming’s electric power sector.
States with the highest per capita CO2 emissions tend to be dominated by coal-related CO2 emissions. Most of these states are coal producers, and coal is their most prevalent fuel used for electricity generation.
Most of the states with the lowest per capita CO2 emissions have little to no coal in their emissions profiles. States such as Washington and Oregon generate a sizable portion of their electricity with hydroelectric power. California and New York, although they are large CO2 producers in total, are both lower than average on a per capita basis.
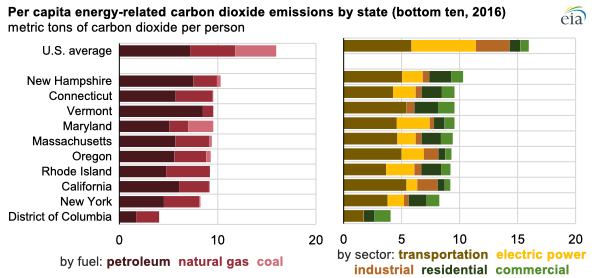
Total energy-related CO2 per capita in the United States averaged 16 metric tons in 2016, and this value declined slightly in 2017. In 2018, energy-related CO2 emissions increased in both absolute and per capita terms, according to preliminary emissions estimates in EIA’s Short-Term Energy Outlook and population estimates published in the Monthly Energy Review. The increase in energy-related CO2 emissions was primarily driven by weather-related energy consumption increases during the year.
Principal contributor: Perry Lindstrom