A gloomy picture as the Trans-Pacific market continues to slide upon slack demand and an unrelenting trade war. An 11.5% drop on CNHK to US over the past 6 weeks, and more
importantly a 2.4% drop from this time last year, reflecting an overall drop of approximately 3% from 2018.
CNHK to Europe remains on a similar downward trend, softened slightly by a stable short term political landscape given a delayed Brexit. A 3.04% drop over the past 6 weeks however a 12% increase from this time last year, largely linked to unpredictable fluctuation in demand particularly since April.
All the while airlines are attempting to align capacity with demand, the market is now firmly in control of spot-market rates as the benefits of a bumper 2017 and 2018 buffer airlines for the slack season.
The Forward Curve
The Freight Investor Services air cargo market report combines data from The Air Cargo (TAC) Index and perspectives from our wide array of clients to provide an view on the historical, present and future air cargo market. Constantly under review, market players can use the report to judge and assess air freight market volatility.The Forward Curve is an amalgamation of previous and prospective market data, weighted by live market information provided by our wide array of corporate clients. When trading an air cargo derivative, you can use the forward curve in conjuction with your own propriortory data to take a view as to where you think the market will turn next.
| Basket | USD/KG | CHANGE | CHANGE % | MTD |
| CHINA - EUR | 2.51 | -0.10 | -3.83% | 2.55 |
| CHINA - USA | 3.22 | -0.14 | -4.26% | 3.22 |
| Blended | USD/KG | CHANGE | CHANGE % | MTD |
| PVG/EUR | 2.44 | -0.22 | -8.73% | 2.42 |
| HKG/EUR | 2.59 | 0.04 | 1.49% | 2.67 |
| PVG/US | 3.06 | -0.10 | -3.31% | 3.00 |
| HKG/US | 3.38 | -0.18 | -5.07% | 3.43 |
'Airfreight routes (AGRs)' provide us with tradeable routes in conjunction with baskets, by maximising volumes along regional tradelanes. AGRs calculate the average of several correlating arrival points noted by their airport codes
| Airfreight Route (AR) | Description | PREVIOUS | USD/KG | CHANGE |
| AGR 1 | HKG to LAX & ORD & JFK | 3.51 | 3.32 | -5.41% |
| AGR 2 | HKG to LHR & FRA & AMS | 2.69 | 2.77 | 2.97% |
| AGR 3 | HKG to SIN & BKK & PVG | 1.16 | 1.18 | 1.72% |
| AGR 4 | PVG to AMS & FRA & LHR | 2.34 | 2.37 | 1.28% |
Forward Curve - Indicative Update
| HKG/CN - EUROPE AGGREGATE LANES - USD/KG | ||||
| BID | ASK | VALUE | CHANGE | |
| Jun-19 | 2.90 | 3.00 | 2.95 | 0.00 |
| Jul-19 | 2.95 | 3.05 | 3.00 | 0.00 |
| Aug-19 | 2.95 | 3.05 | 3.00 | 0.00 |
| Q3 19 | 2.90 | 3.00 | 2.95 | 0.00 |
| Cal - 19 | 3.04 | 3.14 | 3.09 | 0.00 |
| Cal - 20 | 3.44 | 3.54 | 3.49 | 0.00 |

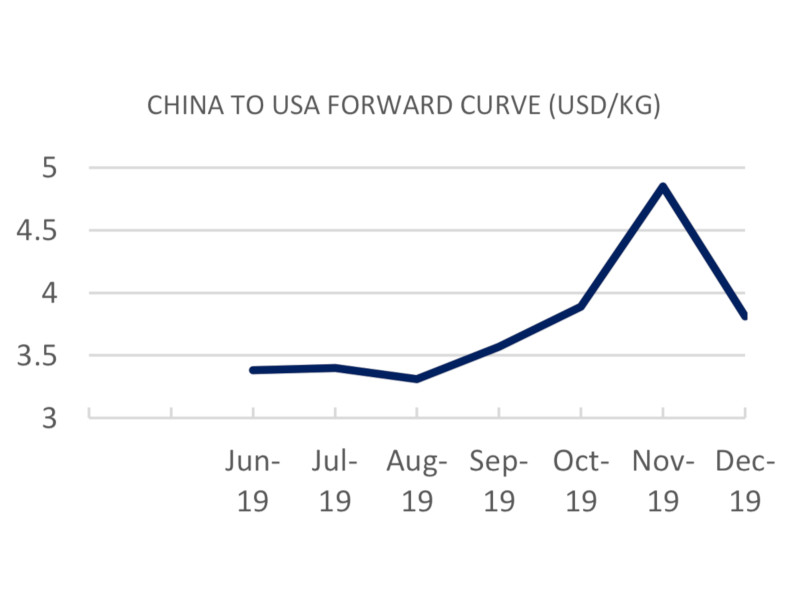
| HKG/CN - US AGGREGATE LANES - USD/KG | ||||
| BID | ASK | VALUE | CHANGE | |
| Jun-19 | 3.33 | 3.43 | 3.38 | 0.00 |
| Jul-19 | 3.35 | 3.45 | 3.40 | 0.00 |
| Aug-19 | 3.26 | 3.36 | 3.31 | 0.00 |
| Q3 19 | 3.69 | 3.79 | 3.74 | 0.00 |
| Cal - 19 | 3.91 | 4.01 | 3.96 | 0.00 |
| Cal - 20 | 4.12 | 4.22 | 4.17 | 0.00 |