Market Comment
A spike in recorded air freight prices from Asia to US immediately following tariff increases, reflects a quicker-than-expected reaction by the market to escalated trade tensions. This is particularly prevalent out of Hong Kong Airport, which will have seen a short and sharp increase in immediate shipments already held in inventory, sent ahead of tariff increases.
Basket |
USD/KG |
CHANGE |
CHANGE % |
MTD |
CHINA - EUR |
2.56 |
-0.08 |
-3.03% |
2.60 |
CHINA - USA |
3.52 |
0.17 |
5.07% |
3.43 |
Blended |
USD/KG |
CHANGE |
CHANGE % |
MTD |
PVG/EUR |
2.47 |
-0.06 |
-2.37% |
2.50 |
HKG/EUR |
2.65 |
-0.10 |
-3.64% |
2.70 |
PVG/US |
3.21 |
-0.06 |
-1.83% |
3.24 |
HKG/US |
3.83 |
0.41 |
11.99% |
3.62 |
Opportunities
Clients facing adverse volatility which is affecting their short term cashflow and profit in peak season can hedge this exposure in the AFFA paper-market.
The Freight Investor Services air cargo market report combines data from The Air Cargo (TAC) Index and perspectives from our wide array of clients to provide an view on the historical, present and future air cargo market. Constantly under review, market players can use the report to judge and assess air freight market volatility. The Forward Curve is an amalgamation of previous and prospective market data, weighted by live market information provided by our wide array of corporate clients. When trading an air cargo derivative, you can use the forward curve in conjuction with your own propriortory data to take a view as to where you think the market will turn next.
‘Airfreight routes (AGRs)’ provide us with tradeable routes in conjunction with baskets, by maximising volumes along regional tradelanes. AGRs calculate the average of several correlating arrival points noted by their airport codes
Airfreight Route (AR) |
Description |
PREVIOUS |
USD/KG |
CHANGE |
AGR 1 |
HKG to LAX & ORD & JFK |
3.3 |
3.48 |
5.45% |
AGR 2 |
HKG to LHR & FRA & AMS |
2.62 |
2.71 |
3.43% |
AGR 3 |
HKG to SIN & BKK & PVG |
1.16 |
1.12 |
-3.35% |
AGR 4 |
PVG to AMS & FRA & LHR |
2.59 |
2.65 |
2.32% |
Forward Curve - Indicative Update

HKG/CN - EUROPE AGGREGATE LANES - USD/KG | ||||
BID |
ASK |
VALUE |
CHANGE | |
May |
2.85 |
2.95 |
2.90 |
-0.10 |
Jun |
2.90 |
3.00 |
2.95 |
0.00 |
Jul |
2.95 |
3.05 |
3.00 |
0.00 |
Q3 19 |
2.90 |
3.00 |
2.95 |
0.00 |
Cal - 19 |
3.04 |
3.14 |
3.09 |
0.00 |
Cal - 20 |
3.44 |
3.54 |
3.49 |
0.00 |
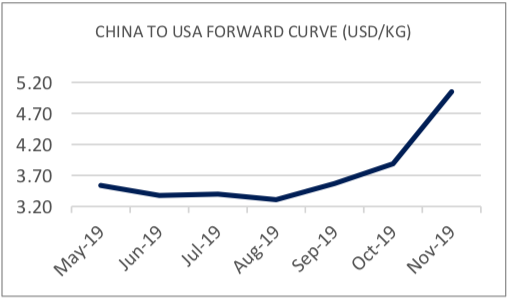
HKG/CN - US AGGREGATE LANES - USD/KG | ||||
BID |
ASK |
VALUE |
CHANGE | |
May |
3.49 |
3.59 |
3.54 |
+0.22 |
Jun |
3.33 |
3.43 |
3.38 |
0.00 |
Jul |
3.35 |
3.45 |
3.40 |
0.00 |
Q3 19 |
3.68 |
3.78 |
3.73 |
0.00 |
Cal - 19 |
3.91 |
4.01 |
3.96 |
0.00 |
Cal - 20 |
4.12 |
4.22 |
4.17 |
0.00 |


