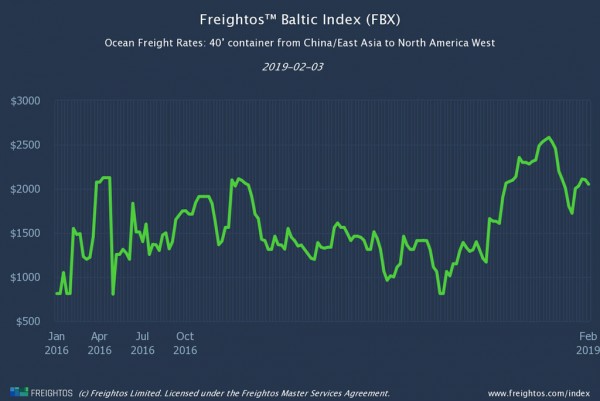
The highest transpacific ocean prices this year were $2,110 on January 20 (China-West Coast) and $3.312 on January 27 (China-East Coast). Prices have fallen only 3% (West Coast) and 1% (East Coast) from these highs. But carriers canceled February 1 GRIs because they know that demand will soon drop off.
“Chinese New Year gives transpacific ocean prices one last boost before the off-season sets in. Prices barely moved this week, easing just $51 and $36 for West Coast and East Coast, respectively. But how long before prices really start falling? On both lanes, the first week-on-week $100+ drop last year took just three weeks. In 2017, it took just two weeks.
And unless the US and China agree to extend the truce deadline, even the trade tariff issue, which has bolstered prices since last June, may not stop the deterioration. That’s because there’s little time left to book a shipment that could clear US customs before March 2.”
- Philip Blumenthal, VP of FBX, Freightos
Ocean Freight Rates
| FBX Lane | Global | China - US West Coast |
China - US East Coast |
China - North Europe |
North Europe - US East Coast |
| This Week | 1582 | 2051 | 3276 | 1704 | 1416 |
| Last Week | -1.00% | -2.00% | -1.00% | 3.00% | 0.00% |
| Last Year* | 21.00% | 45.00% | 20.00% | 8.00% | 0.00% |
* Compared to the corresponding week in 2018
Transpacific prices have gone up 18% (West Coast) and 19% (East Coast) since the beginning of the year. With the pre-Chinese New Year (CNY) bottleneck peak over, West Coast prices eased a little this week (dropping $51 from $2,102 to $2,051 (down 2%) as did East Coast prices (at $36, a 1% drop from $3,312 to $3,276).
Carriers have benefited from the recent high prices, but know that demand drops off after CNY as per normal seasonality. The February 1 GRIs were canceled.
Once China returns to normal after the CNY shutdown, transpacific freight prices usually drop dramatically. Last year, between 25 February and 29 April, West Coast prices fell by 19%, East Coast by 21%. In 2017, between 26 February and 30 April, the corresponding drops were 23% and 26%.
This week’s small decreases to transpacific pricing were largely offset on the global index by modest increases in China-North Europe pricing (a 3% rise from $1,657 to $1,704) and a smaller rise in China-Mediterranean pricing. With no significant movements on any of the rest of the 12 indexes comprising the global index, the global index fell slightly, by $10 to $1,582.
Air Freight Rates
Date |
Europe-US |
China - US |
China - Europe |
12/24/2018 |
$1.52 |
$3.78 |
$2.85 |
12/30/2018 |
$1.45 |
$3.30 |
$2.78 |
01/06/2019 |
$1.53 |
$3.12 |
$2.70 |
01/14/2019 |
$1.55 |
$2.70 |
$2.53 |
01/21/2019 |
$1.50 |
$2.20 |
$2.33 |
01/28/2019 |
$1.50 |
$2.08 |
$2.30 |
02/03/2019 |
$1.50 |
$2.12 |
$2.25 |
The lead-up to Chinese New Year had no virtually no effect on China-US air freight prices. A slight uptick this week was driven by a 10c jump for Shanghai-Los Angeles.
China-US prices have now dropped ten weeks in a row, and are only 44% of their November 26, $4.82 peak.
It’s a similar, but less dramatic, picture with China-Europe prices. They dropped for the 7th week in a row, and are only 62% of their December 10, $3.65 peak.
Europe-US prices continue to remain stable. Carriers continue to offer promotional pricing, as they did right through the pre-Christmas “rush”.