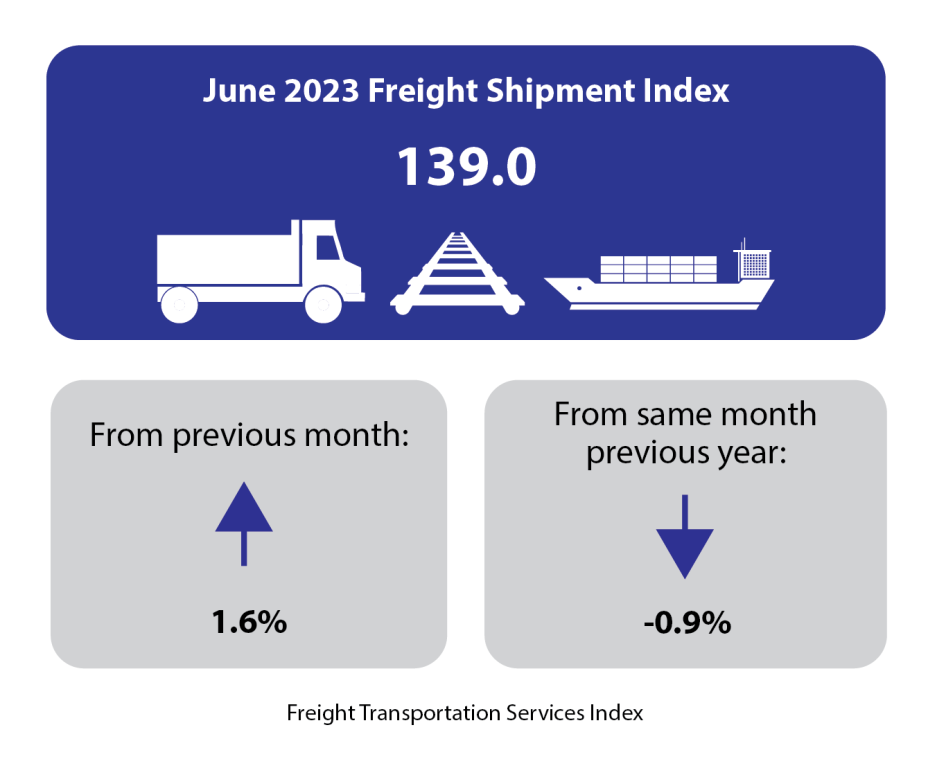
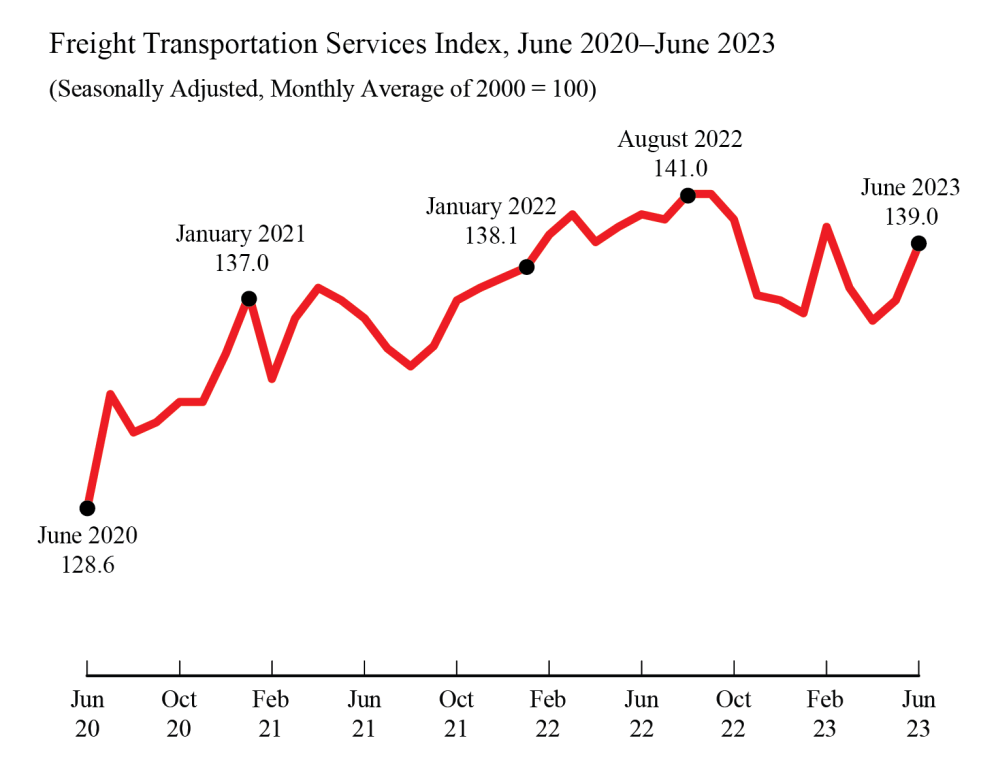
The Freight Transportation Services Index (TSI), which is based on the amount of freight carried by the for-hire transportation industry, rose 1.6% in June from May, rising for the second consecutive month, according to the U.S. Department of Transportation’s Bureau of Transportation Statistics’ (BTS). From June 2022 to June 2023 the index fell -0.9% (Tables 1, 2, and 2A).
The level of for-hire freight shipments in June measured by the Freight TSI (139.0) was 1.6% below the all-time high level of 141.2 in August 2019 (Table 2A). BTS’ TSI records begin in 2000. See historical TSI data.
The May index was revised to 136.8 from 137.6 in last month's release.
BTS will release the passenger and combined indexes for June next month, because air passenger travel continues to deviate from regular seasonal patterns, as it adjusts to the effects induced by the COVID-19 pandemic. The May passenger and combined indexes are available on the BTS website. Air freight for June is also a statistical estimate. Since air freight makes up a smaller part of the freight index, the freight TSI is being released as scheduled with the air freight estimate included.
The Freight TSI measures the month-to-month changes in for-hire freight shipments by mode of transportation in tons and ton-miles, which are combined into one index. The index measures the output of the for-hire freight transportation industry and consists of data from for-hire trucking, rail, inland waterways, pipelines and air freight. The TSI is seasonally-adjusted to remove regular seasonal movement, which enables month-to-month comparisons.
The Freight TSI increased in June due to seasonally adjusted increases in rail intermodal, rail carload, air freight, and trucking, while water and pipeline were down.
The June increase came in the context of mixed results for other indicators. The Federal Reserve Board Industrial Production (IP) Index was down 0.5% in June, reflecting decreases of 0.3% in manufacturing, 0.2% in mining and 2.6% in utilities. Housing starts were down 8.0% while personal income increased by 0.3%.
The Institute for Supply Management Manufacturing (ISM) index was down 0.9 points to 46.0, indicating a decline in manufacturing.
Although the June Passenger TSI is being withheld because of the previously cited difficulty of estimating airline passenger travel and other components, the May index is now being released. The index increased 1.5% from April to May. Seasonally adjusted transit and air passenger increased while rail passenger declined.
The Passenger TSI has now exceeded its level in March 2020 —the first month of the pandemic— for 24 months in a row but remains below its pre-pandemic level (February 2020) for the 39th consecutive month.
Trend: The June freight index increase was the second consecutive increase, following two months of decline, leaving the index 0.5% below the February level. This was only the third increase in the last nine months, for an overall decrease of 1.4% since September 2022. It was the 13th month-over-month increase in the last 22 months, for a total increase of 3.6% since August 2021. The June Freight TSI is 12.1% above the pandemic low in April 2020; it has increased month-over-month in 22 of the 38 months since that low. The index is now 1.6% below its previous record level of 141.2 set in August 2019, despite increasing month-over-month in 22 of the 46 months since that all-time high.


_1_-_127500_-_7bb83b056e5b092b5080f9955525c4bade76e092_lqip.jpg)

