Pre-Lunar New Year cargo surges more than 30 percent
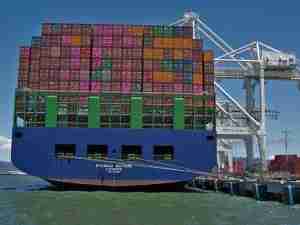
Pier T at the Port of Long Beach.A remarkable start to 2018 continues at the Port of Long Beach, which followed a record January with a historic high in cargo volume for February.
During the month, 661,790 twenty-foot equivalent units (TEUs) moved through the Port, a 32.8 percent increase compared to last February. It’s the first time Long Beach terminals have handled more than 600,000 cargo containers in the month.
Imports climbed 37 percent last month to 342,247 TEUs. The Port handled 130,916 outbound containers, up 9.3 percent. The flourishing import market drove up the number of empty containers needed overseas, rising by 46.5 percent to 188,628 TEUs.
Port of Long Beach Executive Director Mario Cordero said the volumes reinforce a recent trend of ocean carriers shipping a steadier flow of cargo, noting that a decade ago, February’s results would have qualified as one of the biggest months of the year.
“A month like this is now the new normal,” Cordero said. “We expect a lull in March as East Asian nations celebrate the Lunar New Year holiday, and then a rebound in April. We’re very happy with our busy start to 2018.”
“It’s clear new vessel alliances and the increasingly interconnected global economy have shifted cargo patterns,” said Board of Harbor Commission President Lou Anne Bynum. “The Port of Long Beach is investing $4 billion on infrastructure and leveraging technology to ensure our partners are productive and successful.”
The Port of Long Beach is one of the world’s premier seaports, a gateway for trans-Pacific trade and a trailblazer in innovative goods movement, safety and environmental stewardship. The Port is served by 175 shipping lines with connections to 217 seaports worldwide. In 2017, industry leaders named the Port of Long Beach the Best North American Seaport, for the 19th time in the last 22 years, in recognition of the Port’s service, innovation and reliability. A major economic engine for the region, the Port handles trade valued at more than $180 billion each year and supports hundreds of thousands of Southern California jobs.
| February | Fiscal Year to Date*** | |||||
| 2018** | 2017 | %Change | 2018*** | 2017 | %Change | |
| Loaded Inbound | 342247 | 249759 | 37.00% | 1670846 | 1387669 | 20.40% |
| Loaded Outbound | 130916 | 119811 | 9.30% | 641381 | 608643 | 5.40% |
| Empties | 188628 | 128742 | 46.50% | 986187 | 749732 | 31.50% |
| TOTAL (T.E.U.) | 661790 | 498311 | 32.80% | 3298414 | 2746044 | 20.10% |
*TEUs: 20-foot equivalent units or 20-foot-long cargo container
**Preliminary estimate
The size of cargo containers range from 20 feet long to more than 50 feet long.
The international measure is the smallest box, the 20-footer or 20-foot-equivalent unit (TEU).
*** Fiscal Year = Oct. 1 through Sep. 30.