The worldwide air cargo yield fell back to a level of USD 1.89 in January 2018, 7.8% below December, but 16.8% higher than in January 2017.
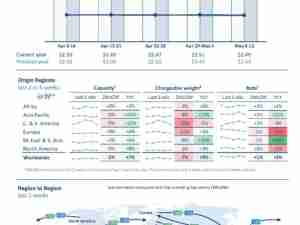
Taking the year-over-year (YoY) figures for January 2018 at face value, 2018 would seem to be off to a very good start. Virtually all airlines recorded a USD-revenue growth, more than one third of all reporting airlines realised volume increases from 10 - 50%, and worldwide volume was up by 8.5% (from Europe and Latin America even by more than 11%). The origin Africa was the month's outlier on two counts. It showed a negative volume growth YoY of 6.7%, but it was also the only region showing a positive USD-yield change month-over-month of 1.8%. All other origin regions recorded USD-yield drops from 1 - 10% MoM, bringing yields back from the lofty peaks they reached towards the end of 2017.
Top growth percentages YoY among the largest origins in Africa came from Ghana (23%), in Asia Pacific from Australia (26%) and Japan (21%), in Latin America from Chile (22%) and Colombia (14%), in Europe from Germany (18%) and the UK (10%), in the Middle East & South Asia from Bangladesh (9%) and India (3%), and in the USA from the Midwest (12%) and the Atlantic South (10%).
Yet, it is too early to qualify this year's start. We have the straightforward information that the worldwide USD-yield rose by 16.8% YoY in January, helped considerably by a devaluing USD: the YoY yield increase was a mere 1.6% in EUR. Volume trends, however, are difficult to interpret, as Chinese New Year (CNY) - a sizeable influence on overall trade - fell on January 28 last year and on February 16 this year. CNY normally has two effects on trade: a spike in trade before, and trade diminishing afterwards. And although the negative influence is usually felt during the two weeks following CNY, the first four days (Jan 28-31 in 2017) bear the brunt of the decrease.
Thus, with GDP-growth in the world continuing, one would expect January to be much better in 2018 than in 2017. But by how much? Based on FTK-data for the first three weeks of January, we believe that YoY volume growth in this "pre-CNY-period" may well have been in the range of 4-6%. A serious growth, surely, but hinting at an overall growth pace lower than the increase shown in the full January-figures. Once February data will be in, we will be able to judge how the start of 2018 has really been.
Looking one more time at the year 2017, we recorded the following trends in the various air cargo product categories. Average worldwide yield for special cargo (excl. perishables) was 45% higher than for general cargo; a year earlier, the difference was 50%. General cargo grew with 11% vs. 7% growth for other cargo categories; the figures for 2016 were 3% and 5% respectively. High tech, flowers and pharmaceuticals showed the highest absolute growth of all special cargo. Biggest contributors to the growth in these categories were Hong Kong & Singapore, Colombia & Ecuador, resp. India & Belgium. Put differently, the biggest contributors to the growth in these three categories, were DB Schenker, Cargomaster, resp. Kuehne + Nagel.