The U.S. Department of Transportation’s Bureau of Transportation Statistics today released its fall 2021 update to the National Transportation Atlas Database (NTAD) with 10 updated and 3 new datasets.
The three geospatial data layers new to NTAD feature transportation-related demographic information showing Household Size by Vehicles Available, Travel Time to Work, and Means of Transportation to Work. These bring the total number of geospatial datasets in the NTAD collection to 93 with an additional 27 ancillary tables.
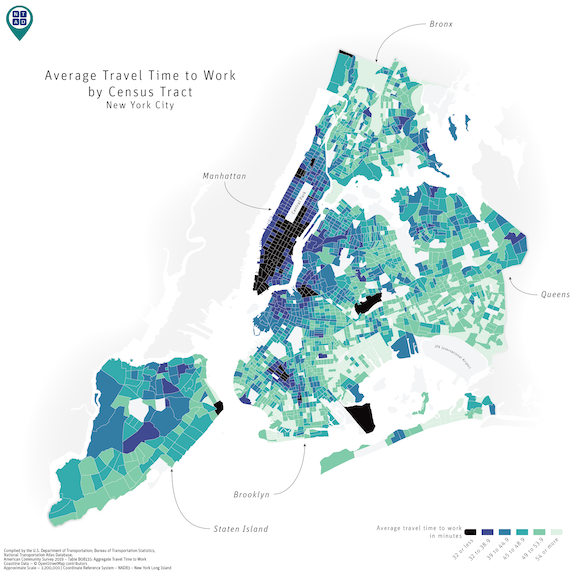
The map above shows travel times in New York City by Census tract with people living in lighter areas having longer commute times. It uses the Travel Time to Work layer recently added to the National Transportation Atlas Database.
The updated layers in this release include:
• Alternative Fueling Stations;
• National Parks;
• Amtrak Stations;
• Marine Highways;
• Strategic Ports;
• Nonattainment Area 8 Hour Ozone (2015);
• North American Rail Lines;
• North American Rail Nodes;
• National Census of Ferry Operator (NCFO) Routes Data correction;
• National Census of Ferry Operator (NCFO) Terminal Data correction;
The three new-to-NTAD layers combine transportation-related demographic information from the 2019 American Community Survey (ACS) with Census tract geometries. The Means of Transportation to Work data, for example, can be used with other datasets, such as EPA's National Walkability Index, to create products like the map below, which displays the percent of travel to work by car with the walkability score at the Census tract level for the San Francisco Bay Area.