Summary
Freight markets are currently dealing with two high-level issues related to COVID-19: the impact of imports and domestic replenishment. Companies in the U.S. increased their inventories last year in response to rising trade tensions with China. This has proven to provide a much-needed buffer to deal with the disruption in imports from China and Southeast Asia in general.
The situation is being complicated with the direct disruption from social distancing and subsequent hoarding of essential items domestically. The vast majority of this freight must move on a truck, and it’s clearly impacting the spot market. We have data and analysis to help guide readers through these disruptions, but ambiguity abounds. A specific area of interest is the result of more aggressive distancing measures on business activity.
The DAT Analytics team is closely tracking the duration and impact of the current disruptions. Other key areas of focus are the impact that will result when the backlog of freight from Asia begins to land, the onset of produce season this spring, and oil prices. We will provide updates as the situation progresses and as information becomes available.

Supply and demand trends
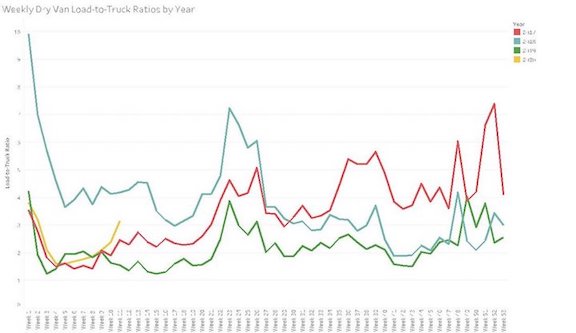
Prior to mid-February, load-to-truck ratios (LTR) were in-line with 2017 levels. In the last two to three weeks, we have seen a decoupling in that trend, with LTRs shooting upwards. This breaks with the pattern from 2019 and sets aim on levels we haven't seen since the high watermark of 2018. We are closely watching this metric, which is collected in real-time based on our load board activity, to assess where the spot market is headed.
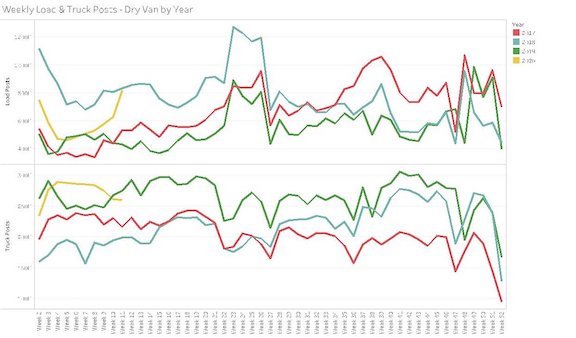
What's driving this change in the LTR? When we dig into the load board activity and RateView database, it becomes evident that the cause is weighted towards the demand side of the equation. This is understandable given all that we are witnessing with replenishment and restocking. Load postings show an even steeper shot upward and are close to matching 2018 levels. Truck posts have ebbed a bit. Our operating thesis is that the contract shipper market is consuming additional capacity, which isn’t bleeding into the spot market.

Rate trends
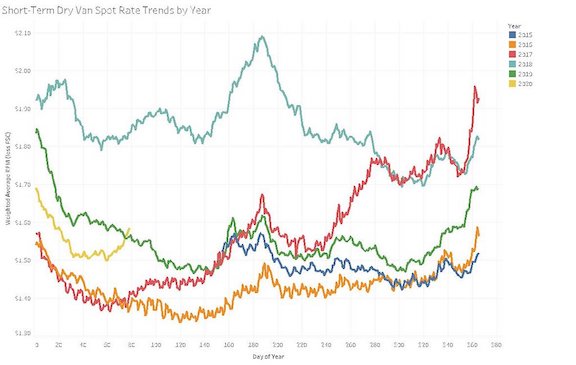
LTRs are one of the best predictors of changes in short-term spot rates. As expected from the observations in the supply/demand trends, rates are trending upward. Given how rapidly this has been developing, we've broken down rates in a way that we typically do not publish broadly. The chart shows a 7-day average of spot dry van rates, updated daily, illustrated by year. This helps smooth out day-of-week effects, but it’s plotted daily to show how things are changing in the extreme near-term.
Since the end of February, rates have been on a sharp and steady climb upward, rising over 5 percent already as of mid-March. Rates have eclipsed 2019 levels. One of the looming questions is how rates will behave as we roll into the spring. We are seeing similar trends in the reefer space, which we expect to be significantly impacted in the coming weeks. Contract rates are holding steady. It’s a 3-legged stool of direction, distance and duration of changes in the spot market that impact contract rates. As these conditions persist, we expect to see changes in contract rates.


