The Drewry Container Port Throughput Indices are a series of volume growth/decline indices based on monthly throughput data for a sample of over 235 ports worldwide, representing over 75% of global volumes. The base point for the indices is January 2012 = 100.
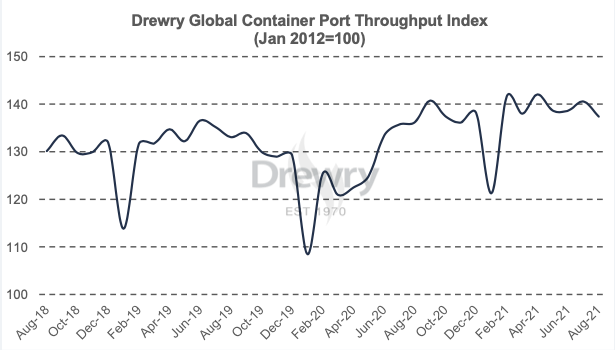
Drewry’s latest assessment - November 2021
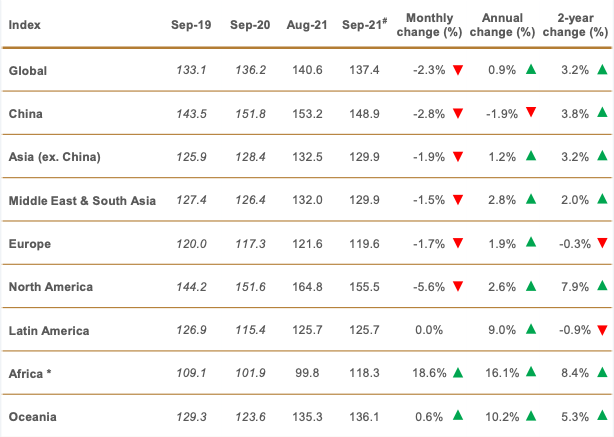
After increasing by close to 2 points in August 2021, the Drewry port throughput index fell by 2.3% (3.2 points) MoM in September 2021. Annual growth is just under 1% , and only 3.2% above the level recorded in September 2019. Volume growth is expected to further slow down in the final quarter of the year due to rising levels of congestion across the major markets - China, North America, Europe.
Greater China was the weakest performer, with the index declining by 4.3 points (2.8%) MoM and 2.8 points (1.9%) YoY in September 2021, although it remained 5.4% higher than the level reported in September 2019. Among top 5 ports, Shanghai witnessed the largest monthly decline (-11% / 0.5 mteu), with only Shenzhen posting a positive performance (7% / 0.2 mteu).
Latin America posted strong YoY increase, with a gain of 10.3 points (9%), but MoM volumes were flat. The index remains almost 1% lower than the September 2019 value of 127 points. The European index is also still below its 2019 level, with congestion taking the steam out of the recovery.
The two smallest regions, Africa and Oceania, were the best performers recording 16% and 10% annual growth in port throughput indices respectively. However, these are small regions and therefore do not have a material impact on the performance of the global index.
* Based on a relatively small sample, and should be viewed with caution
# All index figures for September 2021 are preliminary, subject to change next month