The Drewry Container Port Throughput Indices are a series of calendar adjusted volume growth/decline indices based on monthly throughput data for a sample of over 235 ports worldwide, representing over 75% of global volumes.
Drewry’s latest assessment - August 2022
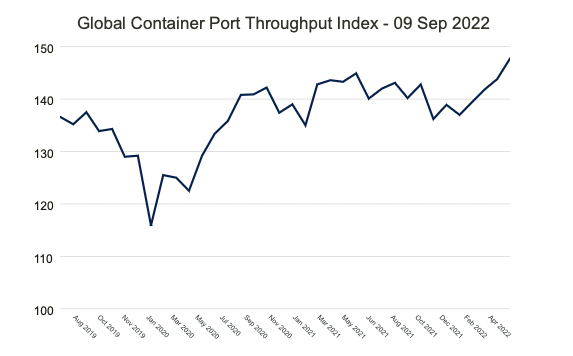
The Drewry Global Container Port Throughput Index reached an all-time high of 147.8 points in June 2022 with 2.0% YoY growth. On a monthly basis, the index inched up by 2.8% as compared to May 2022. Greater China, the Middle East and South Asia and Oceania were the regions that posted monthly as well as annual gains in June.
While lockdowns in China hampered throughput at some ports, the Greater China region still recorded YoY growth of 4.9% in June. Shanghai, the largest port, posted 7.4% YoY decline in June but an increase of 11.4% compared to May which means volumes have started improving. Shenzhen posted a phenomenal 41.4% YoY growth in June 2022, due to the low June 2021 base associated with the partial closure of the Yantian terminal due to Covid restrictions.
Despite struggling with severe congestion, North American ports performed well over the last few months, but declined 1.3% in June MoM - although throughput was still higher by 5.6% YoY.
The index for European ports declined by 4.3% YoY and 1.5% MoM in June 2022. Russia’s invasion of Ukraine has resulted in lower throughput at European ports, pushing up energy costs and leading to high inflation which is expected to take a heavy toll on consumer demand in the coming months.