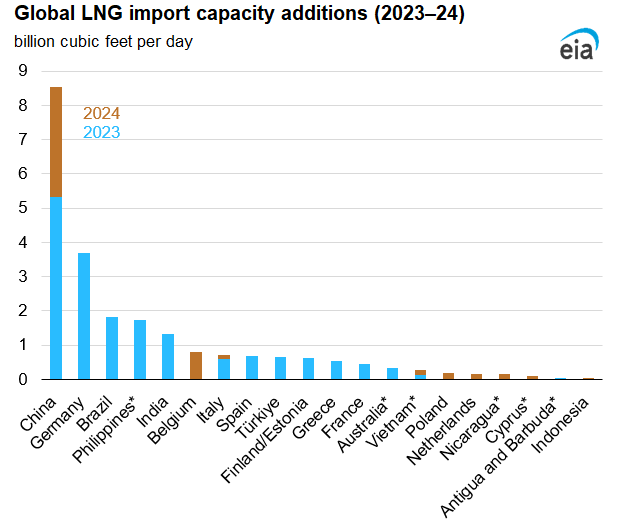
We expect global liquefied natural gas (LNG) import capacity (also known as regasification capacity) to expand by 16%, or 22.8 billion cubic feet per day (Bcf/d), in 2023‒24 compared with 2022 once all regasification terminals currently under construction are completed. In the first seven months of 2023, three countries—Germany, the Philippines, and Vietnam—began importing LNG for the first time. By the end of next year, Antigua and Barbuda, Australia, Cyprus, and Nicaragua are expected to start importing LNG for the first time, and several more countries are in advanced stages of developing LNG import capacity.
Over the past 10 years (2013‒22), global regasification capacity has grown by 49% (45.8 Bcf/d) to reach 140.0 Bcf/d across 48 countries. By the end of 2024, 55 countries are expected to have LNG regasification terminals. Historically, available regasification capacity significantly exceeded LNG imports. Spare regasification capacity, particularly in East Asia, is maintained for security of supply reasons, given the region’s high dependence on real-time LNG imports. Global LNG trade in 2022 amounted to 51.7 Bcf/d, implying 37% utilization of available regasification capacity.
Regionally, Asia will lead the growth in global regasification capacity, accounting for 52% (11.9 Bcf/d) of the total capacity additions in 2023‒24, while Europe will account for 38% (8.6 Bcf/d) and other countries for 10% (2.3 Bcf/d).
In Asia, China and India will account for most of the regasification capacity additions. In particular:
China is building 8.5 Bcf/d of new regasification capacity. After becoming the world’s largest LNG importer in 2021, China’s LNG imports declined in 2022, mainly because of the COVID-related economic slowdown. This year, China is on track to be the world’s largest LNG importer again; however, its LNG imports are expected to remain below available regasification capacity.
India has commissioned one new regasification terminal in 2023 (Dhamra LNG) and is expected to bring online another terminal (Chhara LNG) by the end of this year.
The Philippines and Vietnam became new LNG importers in 2023. With additional terminals under construction, both countries will have a combined total of 2.0 Bcf/d (existing and under construction) regasification capacity online by the end of 2024.
In Europe, LNG regasification capacity is set to expand by one-third by the end of 2024 compared with capacity at the end of 2022, following a reduction in natural gas imports by pipeline from Russia. In particular:
Germany is adding 3.7 Bcf/d of new regasification capacity by the end of 2023 with three existing terminals and three terminals under construction. Germany started importing LNG this year by fast-tracking construction of regasification capacity using floating storage and regasification units (FSRUs).
Italy and Spain are each adding 0.7 Bcf/d of expanded and new regasification capacity.
Finland, Estonia, France, Greece, and Türkiye are adding a combined 2.3 Bcf/d in 2023. Finland and Estonia share use of an FSRU at the port of Inkoo in Finland.
Belgium, Poland, and the Netherlands are expanding existing regasification terminals by a combined 1.1 Bcf/d by the end of 2024.
Cyprus is expected to begin LNG imports next year, commissioning a new terminal with capacity of 0.1 Bcf/d.
Among other regions, in South America, Brazil expects 1.8 Bcf/d of capacity additions to come online this year. Smaller capacity additions in Nicaragua and Antigua and Barbuda, which are expected to become new LNG importers, will total 0.2 Bcf/d by the end of 2024. Australia is building a new offshore regasification terminal on the east coast, with a capacity of 0.3 Bcf/d.
Market Highlights:
(For the week ending Wednesday, August 9, 2023)
Prices
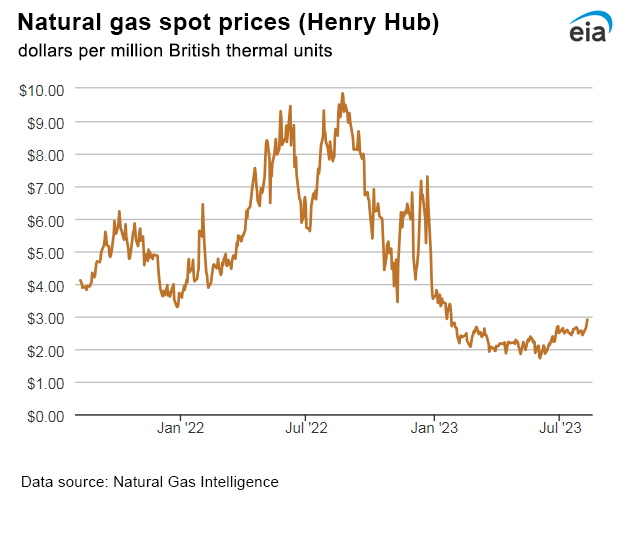
Henry Hub spot price: The Henry Hub spot price rose 48 cents from $2.43 per million British thermal units (MMBtu) last Wednesday to $2.91/MMBtu yesterday. The last time the Henry Hub traded above $2.90/MMBtu was on January 25 of this year, when it traded at $3.08/MMBtu.
Henry Hub futures prices: The price of the September 2023 NYMEX contract increased 48.2 cents, from $2.477/MMBtu last Wednesday to $2.959/MMBtu yesterday. The price of the 12-month strip averaging September 2023 through August 2024 futures contracts climbed 30.8 cents to $3.472/MMBtu.
Select regional spot prices: Natural gas spot prices increased at most major pricing hubs this report week (Wednesday, August 2, to Wednesday, August 9) with two exceptions—Algonquin Citygate and SoCal Citygate. Price changes this week ranged from a decrease of $3.81/MMBtu at SoCal Citygate and an increase of $0.54/MMBtu at PG&E Citygate.
In the Northeast, at Algonquin Citygate, which serves Boston-area consumers, the price went down 5 cents from $1.56/MMBtu last Wednesday to $1.51/MMBtu yesterday. In the Boston Area, temperatures averaged 73°F this week, resulting in 5 fewer cooling degree days (CDDs) than last week. Natural gas consumption in the electric power sector in New England decreased 13%, or 0.2 billion cubic feet per day (Bcf/d), week over week, according to data from S&P Global Commodity Insights. Prices in other Northeast markets increased this week along with the Henry Hub. At the Transcontinental Pipeline Zone 6 trading point for New York City, the price increased 27 cents from $1.16/MMBtu last Wednesday to $1.43/MMBtu yesterday. The Tennessee Zone 4 Marcellus spot price increased 23 cents from $1.06/MMBtu last Wednesday to $1.29/MMBtu yesterday. The price at Eastern Gas South in southwest Pennsylvania rose 26 cents from $1.05/MMBtu last Wednesday to $1.31/MMBtu yesterday.
Prices in the Gulf Coast region increased this week. The Henry Hub rose 48 cents to $2.91/MMBtu yesterday and the Houston Ship Channel rose 53 cents from $2.15/MMBtu last Wednesday to $2.68/MMBtu yesterday. Above-average temperatures persisted in the Houston Area, and the daily high temperature reached above 100°F the last 11 days. Temperatures averaged 92°F this week, resulting in 187 CDDs, 20 more CDDs than last week and 42 more than normal. In Texas, natural gas consumption in the electric power sector increased 4% (0.3 Bcf/d) week over week, according to data from S&P Global Commodity Insights.
Prices increased in West Coast markets, still the highest-priced markets in the United States, except in Southern California where a large maintenance event concluded. The price at Sumas on the Canada-Washington border rose 37 cents from $3.72/MMBtu last Wednesday to $4.09/MMBtu yesterday, and the price at PG&E Citygate in Northern California rose 54 cents, up from $5.17/MMBtu last Wednesday to $5.71/MMBtu yesterday. The price at SoCal Citygate in Southern California decreased by $3.81 from $8.76/MMBtu last Wednesday to $4.95/MMBtu yesterday. Southern California Gas Company (SoCal Gas) indicated maintenance at the Wheeler Ridge compressor station in Kern County had been completed, increasing available pipeline capacity on the system by approximately 0.7 Bcf/d on August 8.
Daily spot prices by region are available on the EIA website.
International futures prices: International natural gas futures prices increased this report week. According to Bloomberg Finance, L.P., weekly average front-month futures prices for liquefied natural gas (LNG) cargoes in East Asia increased 7 cents to a weekly average of $10.98/MMBtu. Natural gas futures for delivery at the Title Transfer Facility (TTF) in the Netherlands increased $1.42 to a weekly average of $10.35/MMBtu. In the same week last year (the week ending August 10, 2022), the prices were $44.61/MMBtu in East Asia and $59.16/MMBtu at TTF.
Natural gas plant liquids (NGPL) prices: The natural gas plant liquids composite price at Mont Belvieu, Texas, rose by 1 cent/MMBtu, averaging $7.24/MMBtu for the week ending August 9. Weekly average ethane prices fell 9%, while natural gas prices at the Houston Ship Channel rose by 3%, narrowing the ethane premium to natural gas by 22% week over week. Ethylene spot prices rose 3%, increasing the ethylene to ethane premium by 20%. Propane prices rose 3%, following the Brent crude oil price, which rose 2%, increasing the propane discount relative to crude oil by 2%. The normal butane price and natural gasoline price each rose 2%, and the isobutane price rose 7%.
Supply and Demand
Supply: According to data from S&P Global Commodity Insights, the average total supply of natural gas fell by 0.6% (0.6 Bcf/d) compared with the previous report week. Dry natural gas production decreased by 0.4% (0.4 Bcf/d) to an average of 102.2 Bcf/d, and average net imports from Canada decreased by 4.4% (0.3 Bcf/d) from last week.
Demand: Total U.S. consumption of natural gas fell by 2.9% (2.2 Bcf/d) compared with the previous report week, according to data from S&P Global Commodity Insights. Natural gas consumed for power generation declined by 4.5% (2.1 Bcf/d) week over week. Industrial sector consumption increased by 0.1% (less than 0.1 Bcf/d), and residential and commercial sector consumption declined by 1.8% (0.2 Bcf/d). Natural gas exports to Mexico increased by 0.6% (less than 0.1 Bcf/d). Natural gas deliveries to U.S. LNG export facilities (LNG pipeline receipts) averaged 12.1 Bcf/d, or 0.2 Bcf/d lower than last week.
Liquefied Natural Gas (LNG)
Pipeline receipts: Average natural gas deliveries to U.S. LNG export terminals decreased by 1.4% (0.2 Bcf/d) week over week, averaging 12.1 Bcf/d, according to data from S&P Global Commodity Insights. Natural gas deliveries to terminals in South Texas decreased by 5.0% (0.2 Bcf/d) to 3.8 Bcf/d, while deliveries to terminals in South Louisiana increased by 0.6% (less than 0.1 Bcf/d) to 7.2 Bcf/d. Natural gas deliveries to terminals outside the Gulf Coast were essentially unchanged at 1.1 Bcf/d.
Vessels departing U.S. ports: Twenty-four LNG vessels (eight from Sabine Pass; four each from Cameron, Corpus Christi, and Freeport; two from Calcasieu Pass; and one each from Cove Point and Elba Island) with a combined LNG-carrying capacity of 89 Bcf departed the United States between August 3 and August 9, according to shipping data provided by Bloomberg Finance, L.P.
Rig Count
According to Baker Hughes, for the week ending Tuesday, August 1, the natural gas rig count was unchanged from a week ago at 128 rigs; the Eagle Ford and unidentified producing basins each added one rig, and the Marcellus and the Permian each dropped one rig. The number of oil-directed rigs decreased by 4 rigs from a week ago to 525 rigs. The Permian dropped four rigs, the Cana Woodford and Eagle Ford each dropped two rigs, the Granite Wash dropped one rig, and five rigs were added in unidentified producing basins. The total rig count, which includes 6 miscellaneous rigs, stands at 659 rigs, 105 fewer rigs than last year at this time.
Storage
Net injections into storage totaled 29 Bcf for the week ending August 4, compared with the five-year (2018–2022) average net injections of 46 Bcf and last year's net injections of 44 Bcf during the same week. Working natural gas stocks totaled 3,030 Bcf, which is 305 Bcf (11%) more than the five-year average and 535 Bcf (21%) more than last year at this time.
According to The Desk survey of natural gas analysts, estimates of the weekly net change to working natural gas stocks ranged from net injections of 19 Bcf to 39 Bcf, with a median estimate of 24 Bcf.
The average rate of injections into storage is 1% higher than the five-year average so far in the refill season (April through October). If the rate of injections into storage matched the five-year average of 9.9 Bcf/d for the remainder of the refill season, the total inventory would be 3,900 Bcf on October 31, which is 305 Bcf higher than the five-year average of 3,595 Bcf for that time of year.


_-_28de80_-_58820516bd428ab3fd376933932d068c43db9a4a_lqip.jpg)


