Trading Update
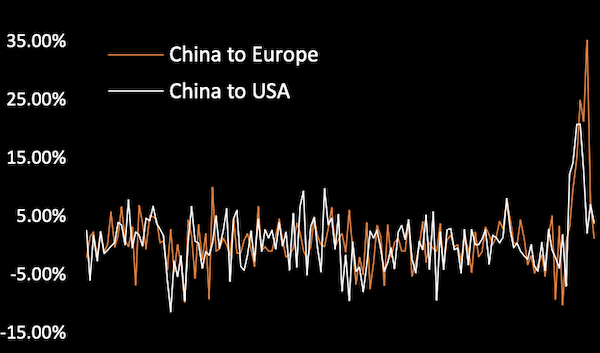
Shanghai continues its monumental price surges, with Shanghai to US gaining 67 cents (up 9.68%) and into to Europe up a softer 14 cents to a monumental high of $8.79. Continuing its reversal, Hong Kong slackens, with the US trade-lane down 21 cents last week.
Hong Kong's fortunes have levelled off the two basket routes somewhat, with China to Europe only gaining a further 7 cents, however China to US shows some fresh energy up 23 cents.
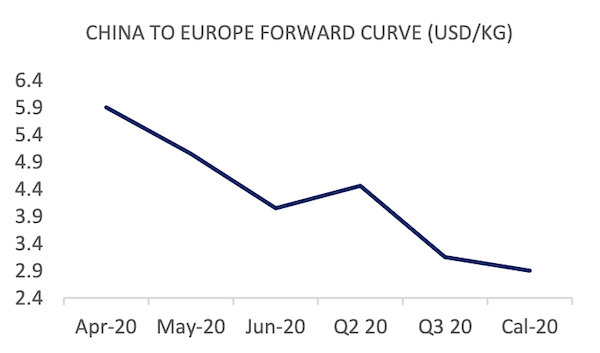
Front-month prices from China to Europe (April 2020) lift $1.17 as bids are raised in line with an unprecedented market, and much of this is carried forward with increased offers all the way through Q2. China to US shows similar trends although, with slightly less dramatic increases, the April 2020 offer has been raised to $6.20.
Market Comment
This week, administration proceedings for Virgin Australia will resonate across the airline industry, as COVID-19 starts to cause casualties. The focus is well and truly on how well airline cargo elements can provide buoyancy to beleaguered airlines - FIS stands by to help.
As part of this, we were pleased to announce that The Baltic Exchange has endorsed TAC Index to provide a road map for benchmark administration and cleared trading. This gives us solid grounding to develop derivative trading volume, helping those that hedge to lock-in their margins and ensure long term business security.
In the news, the continued mayhem surrounding PPE ex.China drives the price. The airfreight market sits atop ballooning demand for medical equipment at eye-watering mark-ups, being absorbed by end-users (governments). The 'on-the-street' rate highs reaching 14-16 $/kg.
The post-COVID environment is, as a result of the PPE 'bubble' and projections for recession and a 2-year airline recovery cycle, impossible to forecast. Price and volume 'bull-whipping' are common go-to's to try to explain forward volatility. However, any analysis will rely on the un-foreseen; will there be a COVID-19 resurgence? How long will the 'Big Lockdown' actually last? What will consumer demand be like on the other side? How will airline capacity react, and how confident will passengers be to fly?.
FIS remains committed to providing a safe flight path through the dense fog of the forward market.
| Basket | USD/KG | CHANGE | CHANGE % | MTD | VOL % |
| CHINA - EUR | 6.73 | 0.07 | 1.05% | 6.54 | 90.24% |
| CHINA - USA | 6.46 | 0.23 | 3.69% | 6.17 | 62.80% |
| Blended | USD/KG | CHANGE | CHANGE % | MTD | VOL % |
| PVG/EUR | 8.79 | 0.14 | 1.62% | 8.26 | 115.38% |
| HKG/EUR | 4.66 | 0.00 | 0.00% | 4.81 | 74.02% |
| PVG/US | 7.59 | 0.67 | 9.68% | 6.95 | 94.55% |
| HKG/US | 5.34 | -0.21 | -3.78% | 5.40 | 52.28% |
| Global | USD/KG | CHANGE | CHANGE % | MTD | VOL % |
| Air Index | 4.72 | 0.09 | 0.69% | 2.27 | 49.63% |
| Lane Pairs | Spread |
| CHINA - EUR vs USA | -0.27 |
| HKG vs PVG - EUR | -4.13 |
| HKG vs PVG - USA | -2.25 |
| Airfreight Route (AR) | Description | USD/KG | CHANGE | CHANGE % | MTD | VOL % |
| AGR 1 | HKG to LAX & ORD & JFK | 5.63 | -0.21 | -3.60% | 5.75 | 35.00% |
| AGR 2 | HKG to LHR & FRA & AMS | 4.63 | 0.35 | 8.18% | 4.67 | 31.00% |
| AGR 3 | HKG to SIN & BKK & PVG | 1.88 | -0.15 | -7.39% | 1.95 | 26.33% |
| AGR 4 | PVG to AMS & FRA & LHR | 8.99 | 0.62 | 7.41% | 8.32 | 74.00% |
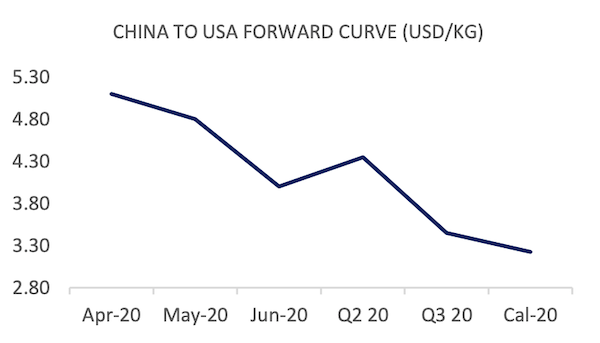
Forward Curve - Indicative Update
| FIS AFFA, CHINA - EUROPE | USD/KG | ||||
| BID | ASK | MID | CHANGE | |
| Apr-20 | 5.00 | 6.80 | 5.90 | 1.17 |
| May-20 | 3.50 | 6.60 | 5.05 | 1.02 |
| Jun-20 | 3.00 | 5.10 | 4.05 | 0.80 |
| Q2 20 | 2.75 | 6.17 | 4.46 | 0.44 |
| Q3 20 | 2.70 | 3.60 | 3.15 | 0.00 |
| Cal-20 | 2.60 | 3.20 | 2.90 | 0.00 |
| FIS AFFA, CHINA - USA | USD/KG | ||||
| BID | ASK | MID | CHANGE | |
| Apr-20 | 4.00 | 6.20 | 5.10 | 0.22 |
| May-20 | 3.70 | 5.90 | 4.80 | 0.37 |
| Jun-20 | 3.00 | 5.00 | 4.00 | 0.15 |
| Q2 20 | 3.00 | 5.70 | 4.35 | 0.20 |
| Q3 20 | 3.00 | 3.90 | 3.45 | 0.00 |
| Cal-20 | 3.05 | 3.40 | 3.23 | 0.00 |