Trading Update
Something the market hasn’t seen for a little while, we are starting to see significant divergence in rate trends. China to Europe finds another gear, lifted up another $1.64 (up 35.81%, $6.22). For the most part this is due to a huge $2.18 gain from Shanghai to Europe (up %42.33%, $7.33) to never-before-seen levels.
China to USA however appears to be faltering, up only 1.92% to what is still a high level $5.83. Shanghai to USA loses 25 cents in a 3.79% drop. The South East Asia internal indicator, AGR 3, losses another 14 cents.
Along both curves, the April and May are lifted by offers on both routes, with China to Europe lifting up $1.04 as a result of a $6.00 AFFA offer.
In other routes, trans-Atlantic prices slip, with London to US dropping 13.7%.
Market Comment
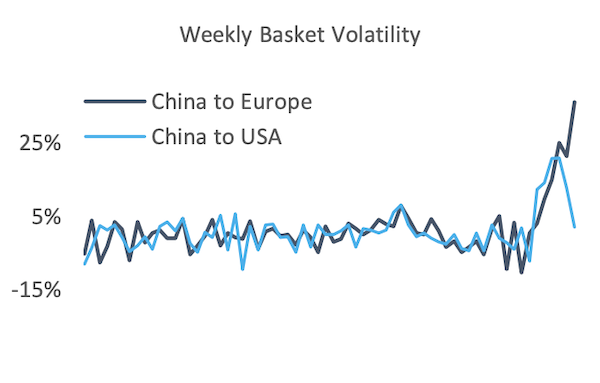
The oscillation of weekly basket volatility tells an interesting story, as the rush of medical equipment and pharmaceuticals into Europe spikes the lane price to never-before-seen highs. This contrasts with the US which for the moment at least, has seen a freeze in its price gains. Both lanes are of course, priced in at very high levels. For those that are hedging against price reduction, this offers a unique opportunity to lock-in these very high earnings against what may well be a downward market at some point in the next 2-3 months.
It would also appear the traffic from Europe to the US has started to falter from a price standpoint, as most major lanes (including Frankfurt and London to USA) see a dip in rates. The overall picture is still outweighed by strong APAC airfreight prices, as more container capacity is restricted forcing urgent cargo onto airfreight.
From our perspective in the UK, we have already started to see casualties in the retail sector, a symptom of completely destroyed demand for anything other than essentials, pharmaceuticals, and trailing shortages as a result of panic buying earlier last month.
As a result of persistent uncertainty, we have now started to see AFFAs being offered into the market for the first few forward months. We stand by to help those that wish to hedge their positions to manage this uncertainty.
| Basket | USD/KG | CHANGE | CHANGE % | MTD | VOL % |
| CHINA - EUR | 6.22 | 1.64 | 35.81% | 6.22 | 96.32% |
| CHINA - USA | 5.83 | 0.11 | 1.92% | 5.83 | 67.30% |
| Blended | USD/KG | CHANGE | CHANGE % | MTD | VOL % |
| PVG/EUR | 7.33 | 2.18 | 42.33% | 7.33 | 121.70% |
| HKG/EUR | 5.11 | 1.10 | 27.43% | 5.11 | 74.78% |
| PVG/US | 6.35 | -0.25 | -3.79% | 6.35 | 101.25% |
| HKG/US | 5.31 | 0.46 | 9.48% | 5.31 | 54.22% |
| Global | USD/KG | CHANGE | CHANGE % | MTD | VOL % |
| Air Index | 4.40 | 0.46 | 10.34% | 2.27 | 49.63% |
| Airfreight Route (AR) | Description | USD/KG | CHANGE | CHANGE % | MTD | VOL % |
| AGR 1 | HKG to LAX & ORD & JFK | 5.78 | 0.73 | 14.45% | 5.78 | 35.00% |
| AGR 2 | HKG to LHR & FRA & AMS | 5.10 | 0.81 | 18.88% | 5.10 | 31.00% |
| AGR 3 | HKG to SIN & BKK & PVG | 1.93 | -0.14 | -6.76% | 1.93 | 26.33% |
| AGR 4 | PVG to AMS & FRA & LHR | 7.61 | 2.47 | 48.05% | 7.61 | 74.00% |
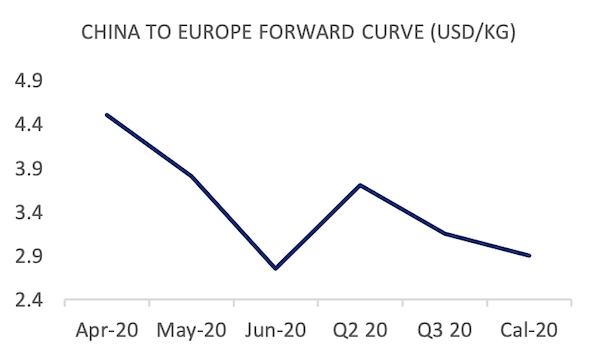
Forward Curve - Indicative Update
| FIS AFFA, CHINA - EUROPE | USD/KG | ||||
| BID | ASK | VALUE | CHANGE | |
| Apr-20 | 3.00 | 6.00 | 4.50 | 1.04 |
| May-20 | 2.60 | 5.00 | 3.80 | 0.85 |
| Jun-20 | 2.55 | 2.95 | 2.75 | 0.00 |
| Q2 20 | 2.75 | 4.65 | 3.70 | 0.87 |
| Q3 20 | 2.70 | 3.60 | 3.15 | 0.25 |
| Cal-20 | 2.60 | 3.20 | 2.90 | 0.00 |
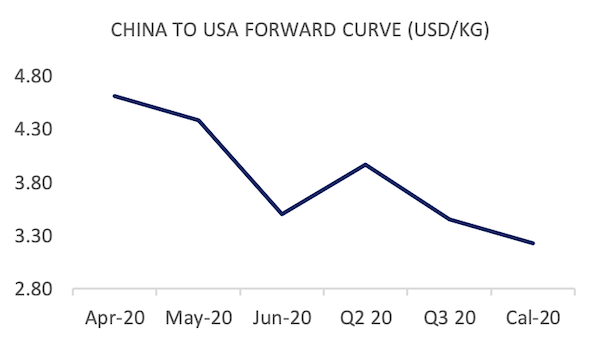
| FIS AFFA, CHINA - USA | USD/KG | ||||
| BID | ASK | VALUE | CHANGE | |
| Apr-20 | 3.71 | 5.50 | 4.61 | 0.25 |
| May-20 | 3.51 | 5.25 | 4.38 | 0.12 |
| Jun-20 | 3.00 | 4.00 | 3.50 | 0.00 |
| Q2 20 | 3.00 | 4.92 | 3.96 | 0.51 |
| Q3 20 | 3.00 | 3.90 | 3.45 | 0.00 |
| Cal-20 | 3.05 | 3.40 | 3.23 | 0.01 |