Trading Update
Both China to Europe and US lanes have seen BID/OFFER interest for September, softening the entry into Q4 significantly compared to 2018. China to Europe is bid at SEP 2.60USD/KG, with China to US offered at SEP 3.29USD/KG.
Recipients of this report are encouraged to contact FIS with bids/offers for future months to increase market depth, even if these are purely indicative.
Market Comment
All lanes bar a few minor examples have slid significantly over the past week, demonstrating near term volatility even during a reportedly flat physical trading month.
Hong Kong to London has had an exceptional few weeks, climbing and maintaining between 3.62 and 3.53USD/KG with the type of progression usually restricted to peak season, retracting slightly by -2.49% however held well above European market price levels.
More moves are being made by carriers to align with cargo demand, with Cathay Pacific joining Lufthansa in restricting slack season freighter traffic, with three B747-400BCFs being picked up by National Air Cargo. Charter markets see renewed activity starting at the end of June, reflecting a last minute manufacturing rush, however it is uncertain whether this is affecting scheduled rates.
Forward Curve
The Freight Investor Services air cargo market report combines data from The Air Cargo (TAC) Index and perspectives from our wide array of clients to provide an view on the historical, present and future air cargo market. Constantly under review, market players can use the report to judge and assess air freight market volatility. The Forward Curve is an amalgamation of previous and prospective market data, weighted by live market information provided by our wide array of corporate clients. When trading an air cargo derivative, you can use the forward curve in conjuction with your own propriortory data to take a view as to where you think the market will turn next.
| Basket | USD/KG | CHANGE | CHANGE % | MTD |
| CHINA - EUR | 2.49 | -0.07 | -2.73% | 2.55 |
| CHINA - USA | 3.27 | -0.16 | -4.89% | 3.29 |
| Blended | USD/KG | CHANGE | CHANGE % | MTD |
| PVG/EUR | 2.42 | -0.05 | -2.02% | 2.43 |
| HKG/EUR | 2.56 | -0.09 | -3.40% | 2.67 |
| PVG/US | 2.95 | -0.30 | -9.23% | 3.18 |
| HKG/US | 3.27 | -0.02 | -0.61% | 3.31 |
‘Airfreight routes (AGRs)’ provide us with tradeable routes in conjunction with baskets, by maximising volumes along regional tradelanes. AGRs calculate the average of several correlating arrival points noted by their airport codes
| Airfreight Route (AR) | Description | PREVIOUS | USD/KG | CHANGE |
| AGR 1 | HKG to LAX & ORD & JFK | 3.23 | 3.21 | -0.62% |
| AGR 2 | HKG to LHR & FRA & AMS | 2.96 | 2.93 | -1.01% |
| AGR 3 | HKG to SIN & BKK & PVG | 1.18 | 1.18 | 0.00% |
| AGR 4 | PVG to AMS & FRA & LHR | 2.47 | 2.30 | -6.88% |
Forward Curve - Indicative Update
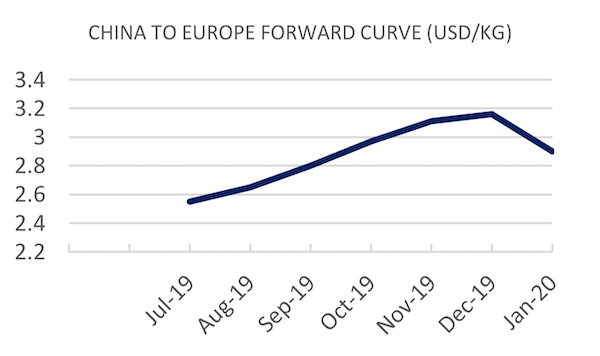
| CHINA - EUROPE | USD/KG | ||||
| BID | ASK | VALUE | CHANGE | |
| Jul-19 | 2.45 | 2.65 | 2.55 | -0.08 |
| Aug-19 | 2.50 | 2.55 | 2.53 | 0.00 |
| Sep-19 | 2.45 | 2.60 | 2.52 | 0.00 |
| Q4 19 | 3.03 | 3.13 | 3.08 | 0.00 |
| Cal - 19 | 3.04 | 3.14 | 3.09 | 0.00 |
| Cal - 20 | 3.44 | 3.54 | 3.49 | 0.00 |
Forward Curve - Indicative Update
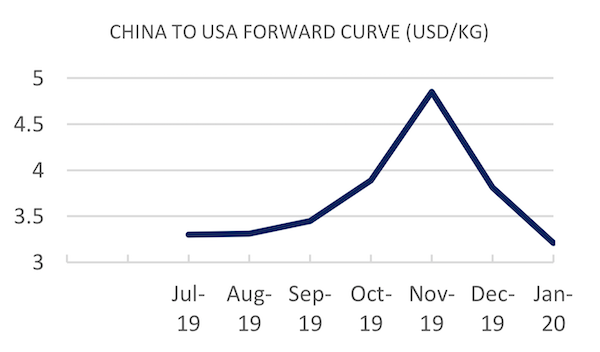
| CHINA - USA | USD/KG | ||||
| BID | ASK | VALUE | CHANGE | |
| Jul-19 | 3.25 | 3.35 | 3.30 | 0.00 |
| Aug-19 | 3.26 | 3.36 | 3.31 | 0.00 |
| Sep-19 | 3.29 | 3.60 | 3.45 | -0.12 |
| Q4 19 | 4.13 | 4.23 | 4.18 | 0.00 |
| Cal - 19 | 3.91 | 4.01 | 3.96 | 0.00 |
| Cal - 20 | 4.12 | 4.22 | 4.17 | 0.00 |