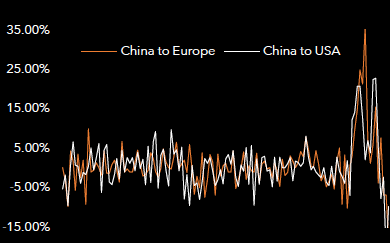
Hong Kong over-takes Shanghai in terms of price into USA, with the spread up to $0.30 turning the dominance of mainland Chinese exports.
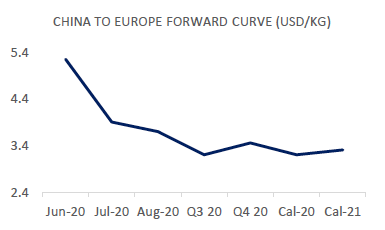
The forward curve reflects the drop-out of the index price, down 50 cents and 55 cents China to Europe/China to USA in June, trailing down into August. The full China to Europe 2020 price is lifted by indicative offers around $3.80, whereas China to USA drops off 25 cents on a weakening immediate outlook.
Market Comment
As we slowly creep towards renewed downstream demand for consumer goods, the container market kicks into action, diversifying the options for transport along Asia Pacific routes. Across the Pacific, threats of trade war escalation, the scrapped Chinese airline ban, and a potential second wave in Beijing rock a number of fundamental drivers for growing non-medical cargoes.
In Europe, AstraZeneca secures the rights to supply 400 million doses of a COVID-19 vaccine (at cost, no less), whilst substantial changes in quarantine rules in Germany, the Netherlands, France, Spain and UK has yet to yield any substantial metrics of a return-to-business.
We start to see some of the winners and losers of the market as prices spool down, still held up in certain regions (Shanghai to Amsterdam bounces back slightly against the market trend to $5.04 off of the back of fixed-price contracts, and prices into London are held up).
| Basket | USD/KG | CHANGE | CHANGE % | MTD | VOL % |
| CHINA - EUR | 4.75 | -1.06 | -18.24% | 5.97 | 94.68% |
| CHINA - USA | 5.18 | -0.57 | -9.91% | 6.02 | 87.86% |
| Blended | USD/KG | CHANGE | CHANGE % | MTD | VOL % |
| PVG/EUR | 5.35 | -1.68 | -23.90% | 7.01 | 119.35% |
| HKG/EUR | 4.16 | -0.44 | -9.57% | 4.93 | 78.16% |
| PVG/US | 5.03 | -0.72 | -12.52% | 6.12 | 112.89% |
| HKG/US | 5.33 | -0.42 | -7.30% | 5.91 | 93.10% |
| Global | USD/KG | CHANGE | CHANGE % | MTD | VOL % |
| Air Index | 3.69 | -0.36 | -5.36% | 2.27 | 49.63% |
| FIS AFFA, CHINA - EUROPE | USD/KG | ||||
| BID | ASK | MID | CHANGE | |
| Jun-20 | 4.00 | 6.50 | 5.25 | -0.50 |
| Jul-20 | 2.80 | 5.00 | 3.90 | -0.25 |
| Aug-20 | 2.90 | 4.50 | 3.70 | -0.15 |
| Q3 20 | 2.50 | 3.90 | 3.20 | -0.05 |
| Q4 20 | 3.00 | 3.90 | 3.45 | 0.00 |
| Cal-20 | 2.60 | 3.80 | 3.20 | 0.15 |
| Cal-21 | 2.70 | 3.90 | 3.30 | 0.00 |
| FIS AFFA, CHINA - USA | USD/KG | ||||
| BID | ASK | MID | CHANGE | |
| Jun-20 | 4.00 | 7.00 | 5.50 | -0.55 |
| Jul-20 | 2.90 | 4.50 | 3.70 | -0.20 |
| Aug-20 | 2.80 | 4.00 | 3.40 | -0.55 |
| Q3 20 | 2.20 | 4.00 | 3.10 | 0.00 |
| Q4 20 | 3.00 | 4.10 | 3.55 | 0.00 |
| Cal-20 | 3.05 | 3.90 | 3.48 | -0.25 |
| Cal-21 | 2.81 | 3.60 | 3.21 | -0.22 |