Trading Update
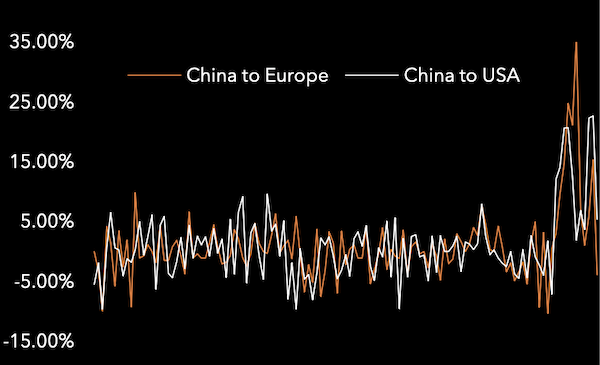
The direction of market prices flips over for China to Europe, as the lane drops off 32 cents over the week, led by a sharp 47 cent decline in Shanghai to Europe prices. Hong Kong to Europe trails with an 18 cent drop.
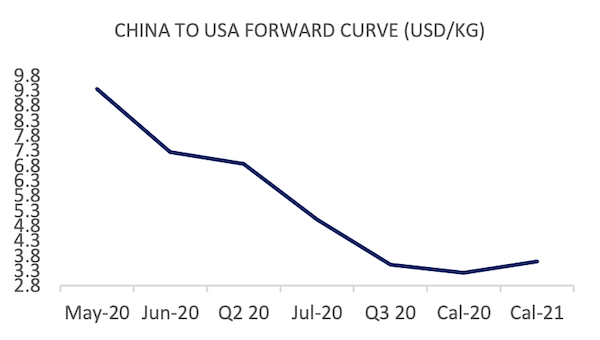
China to USA remains strong however the direction is fairly ambiguous, with Shanghai to USA lifting a massive $1.10 in one week, offset with a 4 cent loss from Hong Kong. The basket route currently sits at $10.21.
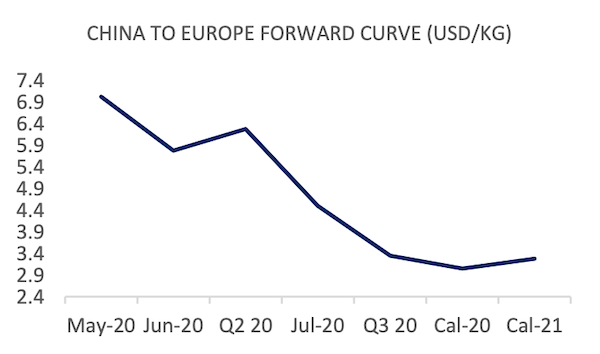
In response to the decreased China to Europe physical price, the entire curve falls into the red. Front-month and June 2020 drops are fairly modest (down 12 and 4 cents), however, a sharp drop in asking price for July 2020 lowers its value by $1.00. China to Europe 2021 prices have been reduced by underlying $2.50 bids.
China to USA gains on Q2 2020, up $1.20 and lifted entirely by the offer/supplier side of the AFFA market. Q3, however, drops off 25 cents revealing a time frame for price normality.
Market Comment
The big news is the reversed direction of the China to Europe price, seeing its first negative move 17th February. Interestingly, the drivers for these price movements have been in direct correlation with underlying volume and load factor data, and the general progression of lockdown policies by European governments. Prices from China to USA seems to replicate China to Europe with a time lag of several weeks.
A core priority will be locking in future cost and revenue in what will be highly turbulent 18 months. The nature of airline bailouts has, by and large, been revealed - without much possible in terms of government bailouts that might surprise us. Meanwhile, the industry has another casualty, as Avianca goes into administration.
Most European nations have begun their lockdown easing procedures, some more confusing than others. The key trend for all of us to watch will be the return (or not) of consumer spending, as warehouses sit full to the brim with inventory. Hand-in-hand is a rapid return of passenger capacity, Lufthansa has already aimed to double its active fleet by June, sucking the life out of the forward price on which many existing cargo-schedules are reliant.
A market-wide push into index-linking is, in our view, the key to tackling the uncertainty of the next two years. The nature and fragility of long term, fixed-price contracts make them impossible to set-up favourably.
| Basket | USD/KG | CHANGE | CHANGE % | MTD | VOL % |
| CHINA - EUR | 7.89 | -0.32 | -3.90% | 8.05 | 85.56% |
| CHINA - USA | 10.21 | 0.52 | 5.37% | 9.95 | 69.85% |
| Blended | USD/KG | CHANGE | CHANGE % | MTD | VOL % |
| PVG/EUR | 9.98 | -0.47 | -4.50% | 10.22 | 109.16% |
| HKG/EUR | 5.80 | -0.18 | -3.01% | 5.89 | 72.22% |
| PVG/US | 11.66 | 1.10 | 10.42% | 11.11 | 90.20% |
| HKG/US | 8.77 | -0.04 | -0.45% | 8.79 | 75.56% |
| Global | USD/KG | CHANGE | CHANGE % | MTD | VOL % |
| Air Index | 6.11 | 0.02 | 2.71% | 2.27 | 49.63% |
Forward Curve - Indicative Update
| FIS AFFA, CHINA - EUROPE | USD/KG | ||||
| BID | ASK | MID | CHANGE | |
| May-20 | 6.00 | 8.05 | 7.03 | -0.12 |
| Jun-20 | 4.00 | 7.55 | 5.78 | -0.04 |
| Q2 20 | 4.80 | 7.75 | 6.28 | -0.25 |
| Jul-20 | 3.00 | 6.00 | 4.50 | -1.00 |
| Q3 20 | 2.70 | 4.00 | 3.35 | -0.50 |
| Cal-20 | 2.60 | 3.50 | 3.05 | 0.00 |
| Cal-21 | 2.50 | 4.05 | 3.28 | -0.20 |
| FIS AFFA, CHINA - USA | USD/KG | ||||
| BID | ASK | MID | CHANGE | |
| May-20 | 7.70 | 11.00 | 9.35 | 1.25 |
| Jun-20 | 4.00 | 10.50 | 7.25 | 0.27 |
| Q2 20 | 3.00 | 10.70 | 6.85 | 1.20 |
| Jul-20 | 3.00 | 7.00 | 5.00 | 0.00 |
| Q3 20 | 2.50 | 4.50 | 3.50 | -0.25 |
| Cal-20 | 3.05 | 3.40 | 3.23 | 0.00 |
| Cal-21 | 3.10 | 4.10 | 3.60 | 0.00 |