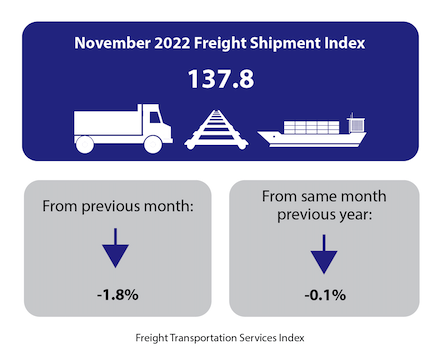
The Freight Transportation Services Index (TSI), which is based on the amount of freight carried by the for-hire transportation industry, fell 1.8% in November from October, falling for the second consecutive month, according to the U.S. Department of Transportation’s Bureau of Transportation Statistics’ (BTS). From November 2021 to November 2022 the index fell 0.1%. (Tables 1, 2, and 2A).
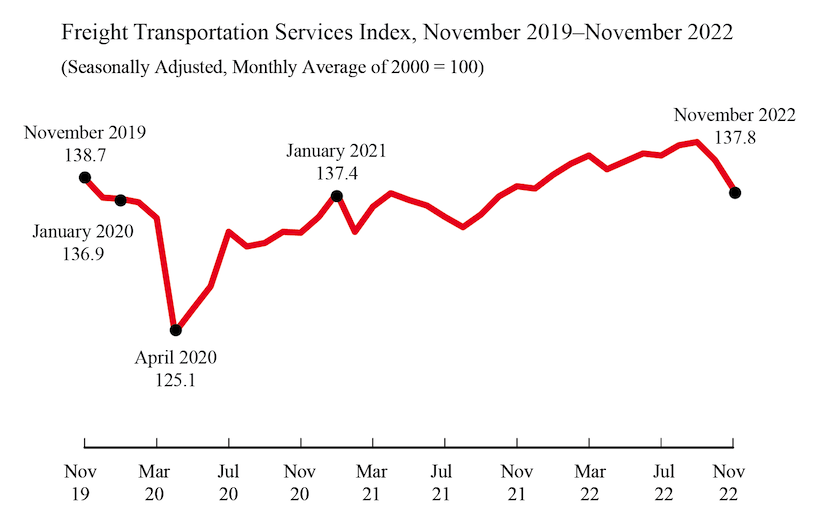
The level of for-hire freight shipments in November measured by the Freight TSI (137.8) was three percent below the all-time high level of 142.1 in August 2019 (Table 2A). BTS’ TSI records begin in 2000.
The October index was revised to 140.3 from 140.9 in last month's release.
BTS is withholding the scheduled release of the passenger and combined indexes for November. The passenger index for November is a statistical estimate of airline passenger travel and other components based on historical trends up to October 2022. The statistical estimate does not fully account for the rapidly changing impacts of the coronavirus on the historical trend. Air freight for November is also a statistical estimate. Since air freight makes up a smaller part of the freight index, the freight TSI is being released as scheduled with the air freight estimate included.
The Freight TSI measures the month-to-month changes in for-hire freight shipments by mode of transportation in tons and ton-miles, which are combined into one index. The index measures the output of the for-hire freight transportation industry and consists of data from for-hire trucking, rail, inland waterways, pipelines and air freight. The TSI is seasonally-adjusted to remove regular seasonal movement, which enables month-to-month comparisons.
Analysis: The Freight TSI decreased in November due to seasonally adjusted decreases in trucking, rail carload, rail intermodal, and pipeline, while air freight and water grew.
The November decrease came in the context of weak results for several other indicators. The Federal Reserve Board Industrial Production (IP) Index declined by 0.2% in October, reflecting decreases of 0.7% in mining and 0.6 in manufacturing, while utilities grew by 3.6%. Housing starts were down 0.5% while personal income increased by 0.4%.
The Institute for Supply Management Manufacturing (ISM) index was down 1.2 points to 49.0, indicating contraction in manufacturing.
Although the November Passenger TSI is being withheld because of the previously cited difficulty of estimating airline passenger travel and other components, the October index is now being released. The index increased 0.5% from September to October. Seasonally adjusted air passenger and rail passenger increased while transit declined.
The Passenger TSI has now exceeded its level in March 2020 —the first month of the pandemic— for seventeen months in a row but remains below its pre-pandemic level (February 2020) for the 32nd consecutive month.
Trend: The November freight index decrease was the second decrease in a row for a total decrease of 2.9% since September and the fourth decrease in eight months for a total decrease of 2.1% since March. It was the fifth month-over-month decrease in fifteen months, for a total increase of 2.5% since August 2021. The November Freight TSI is 10.2% above the pandemic low in April 2020; it has increased in 19 of the 31 months since that low. The index is now 3.0% below its previous record level of 142.1 set in August 2019, despite increasing in 20 of the 39 months since that earlier peak.
Index highs and lows: For-hire freight shipments in November 2022 (137.8) were 45.1% higher than the low in April 2009 during the recession (95.0). The November 2022 level was 3.0% below the historic peak reached in August 2019 (142.1) (Table 1A).
Year to date: For-hire freight shipments measured by the index were at the same level as in November compared to the end of 2021 (Table 3).
Long-term trend: For-hire freight shipments are up 4.2% in the five years from November 2017 and are up 22.8% in the 10 years from November 2012 (Table 5).
Same month of previous year: November 2022 for-hire freight shipments were down 0.1% from November 2021 (Tables 4, 5).
The TSI has three seasonally-adjusted indexes that measure changes from the monthly average of the base year of 2000. The three indexes are freight shipments, passenger travel and a combined measure that merges the freight and passenger indexes.
Revisions: Monthly data has changed from previous releases due to the use of concurrent seasonal analysis, which results in seasonal analysis factors changing as each month’s data are added.
BTS research has shown a clear relationship between economic cycles and the Freight and Passenger Transportation Services Indexes.
Table A: Summary of Revisions to Freight TSI in Previous 12 Months
Freight TSI | |||
Current release | Previous month's release | Percent change | |
Nov-21 | 138.0 | 137.5 | 0.36 |
Dec-21 | 137.8 | 137.8 | 0.00 |
Jan-22 | 139.0 | 139.1 | -0.07 |
Feb-22 | 140.0 | 140.0 | 0.00 |
Mar-22 | 140.7 | 140.7 | 0.00 |
Apr-22 | 139.5 | 139.6 | -0.07 |
May-22 | 140.2 | 140.2 | 0.00 |
Jun-22 | 140.9 | 140.9 | 0.00 |
Jul-22 | 140.7 | 140.7 | 0.00 |
Aug-22 | 141.6 | 141.7 | -0.07 |
Sep-22 | 141.9 | 142.1 | -0.14 |
Oct-22 | 140.3 | 140.9 | -0.43 |
SOURCE: Bureau of Transportation Statistics.
NOTE: The entire Freight TSI is revised monthly. Changes shown only for the previous 12 months.
Table 1: Freight Transportation Services Index since May 2022 Percent Change from Previous Month (Seasonally-Adjusted, Monthly Average of 2000 = 100)
Freight | ||
Index | Percent change | |
May | 140.2 | 0.5 |
June | 140.9 | 0.5 |
July | 140.7 | -0.1 |
August | 141.6 | 0.6 |
September | 141.9 | 0.2 |
October | 140.3 | -1.1 |
November | 137.8 | -1.8 |
SOURCE: Bureau of Transportation Statistics.
NOTE: Percent changes based on numbers prior to rounding.
Table 1A: Annual High and Low Points in Freight Transportation Services Index, 2009-2022
Year | Month of peak | Value at peak | Month of low | Value at low |
2009 | December | 101.9 | April | 95.0 |
2018 | November | 139.8 | January | 131.8 |
2019 | August | 142.1 | December | 137.0 |
2020 | January | 136.9 | April | 125.1 |
2021 | November | 138.0 | February | 134.0 |
2022 (thru November) | September | 141.9 | November | 137.8 |
SOURCE: Bureau of Transportation Statistics.
Table 2: Freight Transportation Services Index Monthly Changes, 2019-2022 Percent change from previous month
2019 | 2020 | 2021 | 2022 | |
Percent change | Percent change | Percent change | Percent change | |
January | 0.7 | -0.1 | 1.6 | 0.9 |
February | -0.6 | -0.2 | -2.5 | 0.7 |
March | 0.1 | -1.0 | 1.6 | 0.5 |
April | 0.7 | -7.5 | 0.9 | -0.9 |
May | 0.2 | 1.7 | -0.4 | 0.5 |
June | -0.2 | 1.6 | -0.4 | 0.5 |
July | 0.9 | 3.7 | -0.7 | -0.1 |
August | 1.3 | -1.0 | -0.7 | 0.6 |
September | -2.4 | 0.2 | 0.8 | 0.2 |
October | -0.1 | 0.8 | 1.2 | -1.1 |
November | 0.1 | -0.1 | 0.7 | -1.8 |
December | -1.2 | 1.0 | -0.1 |
SOURCE: Bureau of Transportation Statistics.
Table 2A: Freight Transportation Services Index by Month, 2019-2022
2019 | 2020 | 2021 | 2022 | |
January | 138.7 | 136.9 | 137.4 | 139.0 |
February | 137.9 | 136.6 | 134.0 | 140.0 |
March | 138.0 | 135.2 | 136.2 | 140.7 |
April | 139.0 | 125.1 | 137.4 | 139.5 |
May | 139.3 | 127.2 | 136.8 | 140.2 |
June | 139.0 | 129.2 | 136.3 | 140.9 |
July | 140.3 | 134.0 | 135.3 | 140.7 |
August | 142.1 | 132.7 | 134.4 | 141.6 |
September | 138.7 | 133.0 | 135.5 | 141.9 |
October | 138.6 | 134.0 | 137.1 | 140.3 |
November | 138.7 | 133.9 | 138.0 | 137.8 |
December | 137.0 | 135.3 | 137.8 |
SOURCE: Bureau of Transportation Statistics.
Table 3: Freight Transportation Services Index Year-to-Date Change, 2013-2022 Percent change to November from December of the previous year
Year | Freight |
2013 | 6.0 |
2014 | 4.8 |
2015 | -1.7 |
2016 | 2.4 |
2017 | 5.9 |
2018 | 4.5 |
2019 | 0.7 |
2020 | -2.3 |
2021 | 2.0 |
2022 | 0.0 |
SOURCE: Bureau of Transportation Statistics.
Table 4: Freight Transportation Services Index from Year-to-Year Percent Change in the November Freight TSI (Monthly average of 2000 = 100)
November Freight TSI | Percent change from same month previous year | |
2013 | 119.0 | 6.1 |
2014 | 123.4 | 3.7 |
2015 | 121.1 | -1.9 |
2016 | 123.6 | 2.1 |
2017 | 132.2 | 7.0 |
2018 | 139.8 | 5.7 |
2019 | 138.7 | -0.8 |
2020 | 133.9 | -3.5 |
2021 | 138.0 | 3.1 |
2022 | 137.8 | -0.1 |
SOURCE: Bureau of Transportation Statistics.
Table 5: Freight Transportation Services Index from Previous Years Percent Change to 2022 (November to November)
Since November . . . | Duration in years | Freight TSI percent change to November 2022 |
2021 | 1 | -0.1 |
2020 | 2 | 2.9 |
2019 | 3 | -0.6 |
2018 | 4 | -1.4 |
2017 | 5 | 4.2 |
2016 | 6 | 11.5 |
2015 | 7 | 13.8 |
2014 | 8 | 11.7 |
2013 | 9 | 15.8 |
2012 | 10 | 22.8 |
SOURCE: Bureau of Transportation Statistics.