The bridges of North America have long been neglected at painful cost. But fixing and replacing existing bridges or building new ones is a costly – estimated at $123 billion - undertaking.Nonetheless, when it comes to infrastructure, bridging the gap between substandard and functional is not only necessary but good business.A bridge in St. Louis in need of much repair
Anyone whose done any driving in the U.S. has crossed an older bridge and experienced an unsettling sensation of rattling and road vibration that only dissipates as the span disappears in the rearview mirror. The unease is justified.
Almost exactly 10 years ago, a bridge carrying Interstate 35 West over the Mississippi River in downtown Minneapolis collapsed, killing 13 people and injuring 145 more. The eight-lane bridge was Minnesota’s third busiest, carrying 140,000 people a day. The I-35 bridge was structurally deficient, meaning that it required significant maintenance, rehabilitation, or replacement. Ironically, 300 tons of construction equipment and materials that had been stored on the bridge deck for ongoing repair work, were partly to blame for the disaster. The NTSB (National Transportation Safety Board) concluded that a design flaw – gusset plates which connect the steel beams – were too thin and stressed by traffic and the additional weight of the repair equipment and materials.
Nevertheless, the collapse (and others) called attention to the problem of the nation’s bridges – unfortunately not enough attention. According to the Federal Highway Administration (FHA), U.S. bridges service nearly 2.0 billion vehicles crossings each day, or more than 730 billion crossings annually, collectively making “bridges” one of the largest and most critical elements of the nation’s infrastructure.
But the American Society of Civil Engineers (ASCE) in their 2017 Infrastructure Report Card notes the U.S. has 614,387 bridges in the National Bridge Inventory, of which almost 40% are 50 years or older. Another 15% are between 40-49 years of age.
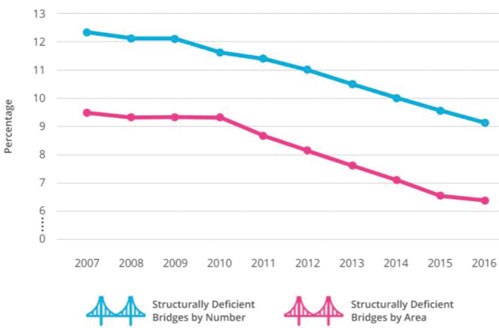
The ASCE went on to report 56,007 or 9.1% of the nation’s bridges were structurally deficient in 2016 (down from just over 12% at the time of the I-35 collapse), and on average “there were 188 million trips across a structurally deficient bridge each day.” The ASCE report noted that while the number of bridges that are in such poor condition as to be “considered structurally deficient is decreasing”. The average age of America’s bridges continues to climb as many of the country’s bridges approach the end of their design life. While structurally deficient bridges are not unsafe, without significant rehabilitation – often requiring closure - these bridges can become unsafe.
The ASCE places the current estimated cost of U.S. bridge rehabilitation at $123 billion. A price tag which only increases with each year as the problem remains unaddressed.
Carrying the Load
One of the complications in tackling bridge rehabilitation is the rising traffic and changing patterns in highway usage. For example, as a part of routine inspection it may be determined that a bridge can only carry traffic up to a certain weight or speed, requiring posting of a load restriction. According to the ASCE 10.1% of the nation’s bridges had such restrictions in 2016. Posted bridges can dramatically increase driving time for larger vehicles needing alternative routings. Further, many bridges which no longer can serve current traffic demands or meet standards, whether due to too few lanes or too narrow lanes or shoulders, are labeled functionally obsolete. The number of “obsolete bridges” is growing and hit 13.6% in 2016.
And the congestion caused by substandard bridges and highways comes at a real cost to the economy. In the 2015 Urban Mobility report, traffic congestion on U.S. highways in 2015 accounted for an average commuting delay of 43 hours per driver annually – up 16% from 2000. In the same study, it was estimated fuel wasted in traffic jams annually rose by 1 billion gallons during the same time frame, and accounting for time lost, cost the American economy $170 billion dollars – a 49% increase over the last 15 years.
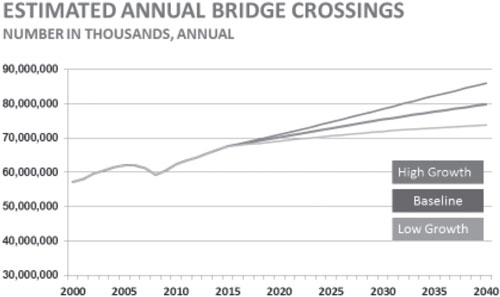
While there has been an active effort to add traffic lanes and build new bridges, construction has not been able to keep pace with the growth. According to the Portland Cement Association (PCA), the total square meters of bridges in the United States has been growing at an annual rate of nearly 3.9 million square meters during the past decade. Even this level of new bridge construction and expansion has fallen short of demographic growth creating a widening gap between bridge improvement and vehicular movements.
The PCA says this shortfall in bridge expansion is reflected in two key congestion measures:
• “Bridges per licensed driver. There were 3.1 bridges per 1,000 licensed drivers in 2000 and 2.3 bridges per 1,000 licensed drivers in 2015 – reflecting a 9.6% decline.
• Bridges per vehicle miles travelled. Perhaps more importantly, there were 23.3 bridges per 100 million vehicle miles travelled in 2000 and 20.5 bridges per 100 million vehicle miles travelled in 2015 – reflecting an 11.9% decline.”
Not so FAST
Back in 2016, Trump the candidate, said in a Fox Business interview, “Nobody can build better than I can. Nobody knows construction better.” Candidate Trump also said he’d double the $275 billion (over five years) in infrastructure spending Hillary Clinton called for in her plan. Right now, it’s unclear where the money will come from to fix the bridges, although both the Republican and Democratic leadership agree that infrastructure spending – particularly on items like bridges - is a priority. However, they fundamentally disagree on where the money will come from.
In December 2015, Congress passed the Fixing America’s Surface Transportation (FAST) Act, a five-year surface transportation bill, designed to secure federal funding through 2020. However, not surprisingly, implementation of the increased funding levels included in the FAST Act have been delayed due to Congress’ inability to pass a new spending bill.
The current federal estimate puts the backlog of rehabilitation bridge projects at $123 billion. Federal financing for bridge projects has been paid for from the Highway Trust Fund (HTF). The fund has been teetering on the brink of insolvency for nine years due to the limitations of its primary funding source, the federal motor fuels tax.
ASCE in their Report Card suggested a number of fixes to the bridge problem beginning with “Increase funding from all levels of government to continue reducing the number of structurally deficient bridges, decrease the maintenance backlog, and address the large number of bridges that have passed or are approaching the end of their design life.” But the problem lies with the funding mechanism. Can the HTF really be fixed? One approach is to raise the current user fee of 18.4 cents per gallon on gasoline and 24.4 cents per gallon on diesel and link these fees to inflation to ensure purchasing power parity as time goes on. But who in Congress wants to be the one proposing to raise taxes?
In the meantime, the gap between maintaining functional bridges and deficient ones will continue to widen as the ultimate cost continues to rise.