Chris Jones is EVP of industry and services at Descartes-Datamyne, a company that produces high quality trade intelligence, particularly on international ocean container shipping. In an interview with the AJOT, Jones lends his interpretation to the data concerning some notable shipping trends.
AJOT – With the falling demand in the US in 2023 (after the robust 21-22 box surge), what import trends are US ports posting?

AJOT – Is the shift from West Coast, particularly the San Pedro ports of LA and LB, to the East Coast and Gulf still a factor?
Chris Jones – The share of container traffic began to shift away from West Coast ports in favor of their East and Gulf Coast counterparts from about May last year. The gap has been widening ever since. Port congestion and port transit delays were partly responsible for the re-routing of shipments away from the major transportation hubs of Los Angeles and Long Beach. Shippers, already reeling from not being able to get their products to market in time, feared the worst as the ILWU contract negotiations began last summer. While there were no work stoppages and with recent declining volumes reducing port transit delays below 10 days – a significant improvement compared with 15+ days last year, but still way off the low single digits of the pre-pandemic years – observers might have speculated that business would ebb back into West Coast ports. Latest figures, however, tell a different story. Share of container volume for the top five East and Gulf Coast ports rose 1.6% to 46.8% in February 2023, compared with the month before. In contrast, the figure for the top five West Coast ports retreated 2.8% to 36%. It’s a case of once bitten twice shy. The memory of the harsh operating conditions last year is still fresh in everyone’s minds. Shippers and their transportation partners are likely to continue to walk a cautious line until the ILWU negotiations are settled.

AJOT – In terms of sourcing, how much trade in terms of TEUs has moved to Southeast Asia and South Asia to the US since 2019? How have the routes and gateways changed with the sourcing?
Chris Jones – Southeast Asia and South Asia TEU traffic into the U.S. increased 43% between 2019 and 2022, from 4.4 million to 6.3 million containers. However, last year’s year-on-year growth slowed to just 3% after two years of double digit rates of expansion. (See Fig 1). This is in line with the import volume declines at the overall macro level associated with a drop in U.S. consumer spending because of high inflation and worries about the future outlook of the economy. Extrapolating from the 2023 first quarter numbers, container volumes appear to be trending lower compared with 2022.
fig 1.

The robust growth rate from 2019 is driven by the shift away from China, whose image as the manufacturing assembly hub of the world was dented with previous administration era duty and tariff hikes with other more recent factors being the large scale COVID lockdowns that halted industrial production for months at a time and rising Asia-Pacific Rim tensions. U.S. manufacturers’ perception of China being an attractive business environment is fading and they are hedging their investment bets by setting up shop in places like Southeast Asia and South Asia where the operating climate is more predictable and stable. To hit home the point, Vietnam’s exports to the U.S. between 2019 and 2022 jumped almost 60% to 2.3 million TEUS mainly on shipments of electrical and electronic equipment, furniture, and apparel items. Other beneficiaries of the shift away from China included India, Thailand, Indonesia, Malaysia, and Pakistan.
Also, in line with the macro trend, shippers shifted trade lanes away from the West Coast and in favor of East Coast and Gulf Coast ports (See Fig 2) initially because container congestion affected the West Coast more and latterly because of fears of work stoppages if the ILWU contract negotiations turned contentious.
Fig 2

AJOT – How Have China’s (Hong Kong included) TEU exports to US ports fared since 2019?
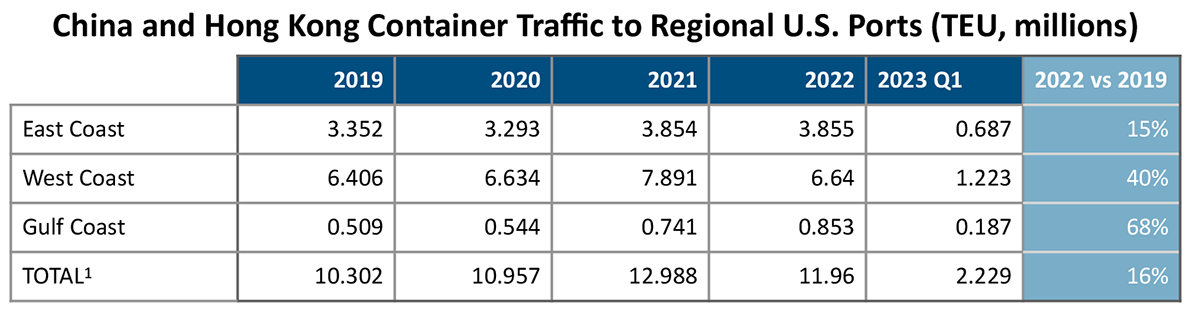
Chris Jones – China (including Hong Kong) exports to U.S. ports increased 16% between 2019 and 2022 (See Fig A). The overall gains were tempered by 2022’s year-on-year retreat of 8%, the result of widespread lockdowns of entire cities and regions as part of government efforts to bring COVID under control. Extrapolating from the 2023 first quarter numbers, it is likely that volumes will be lower than for 2022, in line with reduced consumer purchases.
Fig A