Port of Boston finds growth from its niche environs
New England’s Port. The Port of Boston, specifically Massport’s container facility at Conley Terminal, is New England’s port. For years, it might have been debatable whether the Port of Montreal in Canada or the Port of New York/New Jersey was really New England’s port but not now. That day has passed.
What’s changed over a few decades? Well, to begin with Massport’s strategic goals have shifted. This began in earnest with consolidation of the two container facilities in the mid-1990s – the J.F. Moran facility in Charlestown - into one main facility at Conley Terminal in South Boston.
Many other public projects were taking place at the time of consolidation, notably the “Big Dig” and the adjoining Ted Williams cross-harbor tunnel, which linked Logan Airport (also a Massport asset) with South Boston and access to points north, south and west of the City of Boston. Besides the more ‘public’ projects, harbor dredging operations began – a crucial infrastructure need to match the terminal overhaul.

The role of the new, consolidated Conley Terminal also began to evolve. The concept of a “gateway” to the Midwest – a role, arguably better fulfilled by many ports in the region with more favorable geography (see Northeast article on page 4) – was transplanted with the idea of the port being a niche port for the greater New England region beginning with the metro region immediately adjacent to the container port itself.
The strategic shift was made easier by what was right at hand, a world class metropolitan area. There are an estimated 7.6 million people living in the greater Boston area, ranking in GDP terms 6th in the U.S. and remarkably, 12th in the world. The wealth just off the piers was sufficient to attract the ocean carriers providing the ship call worked within the vessel overall rotations and did so, at a competitive cost.
Carving Out a Niche
Competitive cost is among other things based on the container volumes being shifted. Cleaning out bays full of containers is more efficient than cherry picking a few here and there. Smaller container ships, with inherent imbalances in trade (at points in time as much as 80%-20% inbound to outbound), coupled with lower capacity equipment and a Northeast climate, can make handling costs seem high vis-a-vis other Northeast container ports competing for the same business. In the case of the containership industry, size and volume are big calling cards and often trump niche business – no matter how attractive. And Boston is surrounded by big volume ports.
In 2017, the Port of New York/New Jersey, the East Coast’s mega-port, handled a record 6.71 million TEU and is only 200 miles from Boston. The Port of Montreal to the north in 2017 had a throughput of 1.54 million TEU and is only 300 miles away. And there is the Port of Halifax lying 400 miles to the northeast, which in 2017 notched 559,292 TEU.
These ports compete directly for cargo and ship calls with the Port of Boston. In the consolidated world of carrier alliances, it might be argued that even ports like Norfolk, Virginia; Baltimore, Maryland and the Delaware River ports of Wilmington, Delaware and Philadelphia, Pennsylvania are also in the competitive mix for freight and port calls.
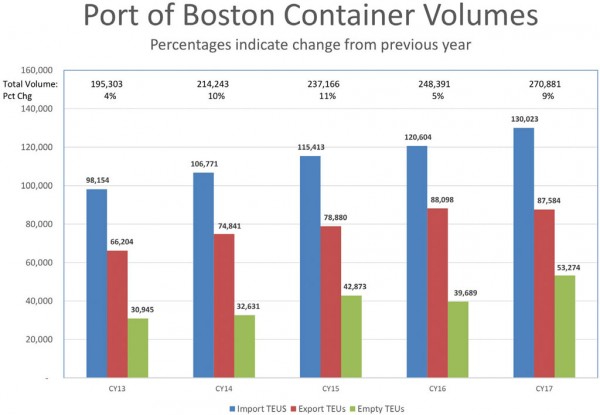
Nonetheless the Port of Boston is on a remarkable run. In 2013 the port’s throughput was 195,303 TEU and every subsequent year, the throughput has been over 200,000 TEU – including a record 270,881 in 2017. While Boston’s total TEU throughput is certainly smaller than the surrounding gateways, it represents a great deal more traffic than was in the “dead port” forecasts of the early 1990s (during this dire stretch there was even a coffin black coffee mug circulating among port users with the tagline: “Thanks for the memory” “Boston SeaPort 1630-1990”).
Delving a little deeper into the box numbers, there is also another positive takeaway. In 2013 the port handled 66,204 outbound TEU. In 2016 the figure had risen to 88,000 TEU before falling back slightly in 2017 to 87,584 TEU. For a consumer dollar driven heavy inbound destination like Boston registering an export TEU percentage of over 30% (not including empties) is an acceptable result. Few ports in the region are able to post inbound-outbound balance – the Port of Montreal being the exception (see Leo Ryan article on page 2).
So, the question is, how can a regional niche port survive and indeed thrive, as the Port of Boston has been able to do?
For many years, there was a popular school of thought among port planners of hub-ports like the Port of New York/New Jersey being linked to much smaller satellite ports, akin to the hub and spoke networks or airports. The idea – still popular in some circles – was ocean carriers’ linehaul ships would call in two or three East Coast hub or gateway ports and the rest of the smaller ports would be serviced by barges, rail and lots and lots of trucks.
The hub port concept never fully played out for a variety of reasons. From a socio-economic port of view, states like having their own ports. Further, elected officials in port states are notably less concerned about (RE: voters) other states, no matter what the logic of freight patterns might dictate. The Federal government generally doesn’t like to play favorites and dredging funds have been widely dispersed – somewhat leveling the playing field between ports for the larger containerships.
Secondly, ocean carriers can and do ‘take their business elsewhere’ when the numbers or conditions (facilities and infrastructure) aren’t favorable. Taken together, these two conditions have opened up the U.S. port system to the development of multiple niche ports, like Boston.
But this doesn’t guarantee market share. The key was building an efficient facility that ideally could be scaled to future business and to attract the region’s freight traffic – both inbound and outbound - to the facility.
Terminal Progress
Dredging is among the most important challenges for the port. From a purely practical point of view, the port needs the water depth to handle the larger vessels transiting the modernized Panama Canal.
The dredging project took an important step forward, when in June 2014, the then President Obama signed the Water Resources Reform and Development Act (WRRDA) into law. In September of 2017 the dredging project officially kicked off. The size of the investment is significant. The overall estimated cost for the project is $350 million, including $130 million from Massport and the State of Massachusetts and another $220 million in federal funding, including $18.2 million allocated in the USACE’s (U.S. Army Corps of Engineers) FY 2017 work plan and $58 million included in the President’s FY’18 budget.
The USACE contracted Great Lakes Dredge and Dock to perform the dredging work. Economic development legislation proposed and signed by Governor Baker last year also permitted $107.5 million for Massport infrastructure investments at Conley Container Terminal, including the construction of a new berth and procurement of three new Post-Panamax cranes. Phase One of the project consists of maintenance dredging, including the construction of a Confined Aquatic Disposal (CAD) Cell just off the shore of the Autoport in Charlestown. This work is expected to continue through the end of the year.
Phase Two of the project, scheduled to begin in mid-2018, will deepen the Outer Harbor Channel, from 40-feet to 51-feet; the Main Shipping Channel, from 40-feet to 47-feet; and the Reserve Channel, where Conley Container Terminal is located, from 40 feet to 47 feet. Currently, Conley is able to handle 8,500 TEU ships - this project will allow it to handle up to 12,000 TEU vessels.
Another important step forward for the terminal improvement project was the October 2017 opening of the much anticipated, freight corridor. The 3,100-foot bypass road known as the Thomas J. Butler Freight Corridor is designed to move Conley Container Terminal truck traffic from South Boston’s heavy residential areas on East First Street and part of Summer Street, rerouting it through the former Coastal Oil site to connect to the major highways. As part of the $75 million project, it includes a 0.6-mile dedicated roadway for Conley Terminal and a 500-foot long bridge across the former Exelon Power Plant inlet at the Reserve Channel.
Port Productivity
Port productivity is essential for a niche port like Boston to retain its ocean carriers. With the latest round of carrier consolidations and a reduction to three global carrier alliances, productivity is more important than ever. Long truck turns and slow container lifts off-and-on the ships, kills productivity and dampens a carriers’ enthusiasm to keep calling. The difference now is with so few players, replacing a lost ship call isn’t simply attracting another individual carrier but an alliance worth of carriers’ – no mean feat with the Northeast port competition.
The terminal overhaul of gates and associated infrastructure has improved truck turn times. In 2017 the longest turn times occurred in December at 39 minutes while July, August and September truck turn times averaged 37 minutes.
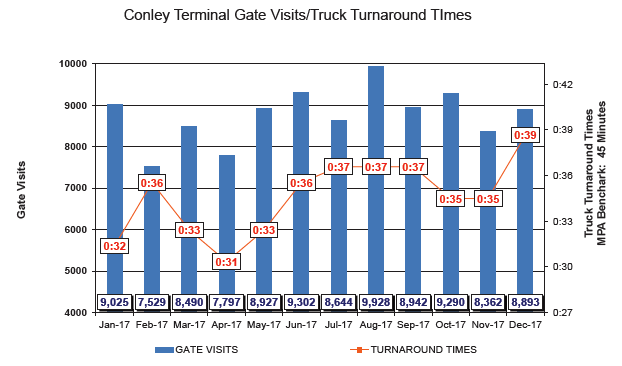
The best months for truck turn times in 2017 were January, at 32 minutes, March, at 33 minutes and April, at 31 minutes. From the perspective of truck traffic, the months with the highest volumes of traffic were January at 9,025, August 9,928 and October at 9,290. The weakest month for gate visits was February at 7529 (see chart). Although no metropolitan area is free from traffic congestion, Boston is still a good alternative when compared to metro New York for shifting containers… with the caveat that many boxes transit both metro regions, arguably experiencing the worst of both regions.
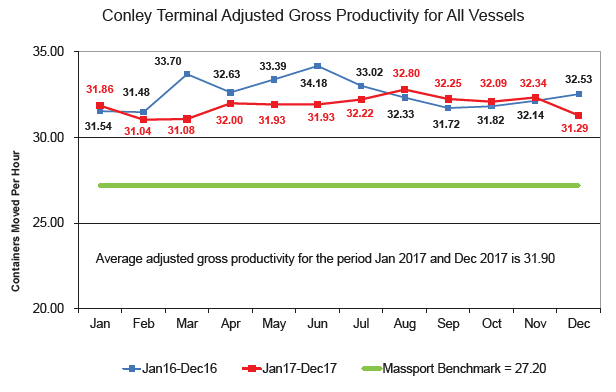
A second element of the emphasis on productivity is with gantry cranes that lift containers on and off the container ships. Massport and the International Longshoremen’s Association (ILA) agreed to an innovative union contract based on crane productivity. Massport and the ILA agreed on a productivity baseline of 27.20 moves per hour. Ship sizes and stowage – where the containers are on the ship and how many are moved on and off - plays a big role in crane productivity. Simplistically, bigger ships with larger groups of port designated containers enable higher production than smaller ships with more complex stowage. Weather also plays havoc with pier production. However, in 2017, crane lifts per hour were fairly consistent throughout the year ranging from a low in February of 31.04 to a high in August of 32.80 (see chart).
Massport’s engineered a remarkable turnaround for the Port of Boston. It’s estimated to have the terminal footprint to expand into a 400,000 TEU facility, assuming issues outside terminal gates don’t constrict growth.
The Port has become a model for how a “niche” port can co-exist in a region with nearby gateway ports like the Port of New York/New Jersey or Montreal. But there’s a cautionary tale in the City’s robust development. Real estate pressure on waterfront property in South Boston is rising to unprecedented levels. And while condos and other activities can exist nearly anywhere, a port can only be a port with access to the sea…and to the hinterland land. The black coffee mug still serves as a reminder that today’s success is not guaranteed tomorrow.


