Details of food imports sanctioned by Russia
By: Reuters | Aug 07 2014 at 04:25 PM | International Trade
Moscow imposed a total ban on imports of many Western foods in retaliation against sanctions over Ukraine, a stronger than expected measure that isolates Russian consumers from world trade to a degree unseen since Soviet days.
The sanctions affect the 28 European Union members, the United States, Canada, Australia and non-EU member Norway.
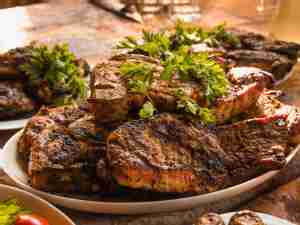
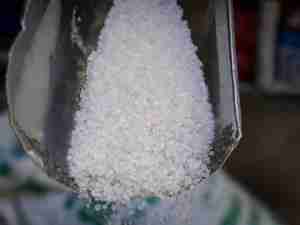
They cover all meat, fish, poultry, dairy, fruit and vegetables. Food items that are not covered mostly include commodities such as tea, coffee, sugar, grains and seed oil.
Russia imported about $39 billion worth of food last year from all countries, about $23.5 billion of which was in categories affected by the sanctions. From the countries covered by the sanctions, Russia imported $17.2 billion worth of food, of which $9.2 was in the affected categories.
Food is only a small part of Russia’s trade with the West: total imports from countries covered by the ban were $155.3 billion in 2013, according to U.N. data.
The ban is valid from Aug. 7 and will last for one year. (Reuters)
Following are details of the most valuable types of imports affected and the value imported from each sanctioned country last year. Figures are from the International Trade Center, a joint venture of the United Nations and World Trade Organization.
Value of Sanctioned Imports, by Product(*)
2013 Pct Change ($ mln) from 2012
Imports sanctioned by Russia 9,204.5 -1.4
Of which:
Pork, fresh, chilled or frozen 1,569.9 -16.0
Cheese and curd 1,282.9 13.4
Fish, fresh, whole 909.6 12.2
Food preparations 802.8 12.4
Apples, pears, fresh 727.2 -9.6
Poultry meat 432.4 -3.2
Fish, frozen, whole 420.1 12.2
Fresh stony fruit (apricots etc) 329.0 -13.3
Tomatoes 291.7 39.9
Other fresh fruit 232.3 -2.6
Butter, dairy fats and oils 223.0 41.9
Vegetables 205.3 -8.6
Nuts 191.3 26.1
Frozen beef 165.6 -63.8
Citrus fruit, fresh or dried 149.8 -15.9
Crustaceans 121.2 -1.4
Fresh/chilled beef 110.6 -30.1
Milk or cream, conc./sweetened 99.3 128.9
Cabbages and cauliflowers 84.7 12.3
Sausage and similar products 77.5 20.3
Frozen vegetables 76.6 21.1
Milk and cream 73.2 49.2
Fish fillets and pieces 73.0 -29.3
Grapes, fresh or dried 67.2 -16.6
Buttermilk and yogurt 64.9 33.0
Onions, garlic and leeks 56.8 23.6
Cucumbers, gherkins 56.7 33.5
Carrots, turnips, beetroot 51.6 46.0
Potatoes 51.5 -35.4
(* Imports worth less than $50 mln in 2013 not shown)
Value of Sanctioned Imports by Country
2013 Pct Change ($ mln) from 2012
Norway 1,158 5.5
Poland 1,122 26.5
United States of America 838 -32.1
Spain 794 -12.2
Netherlands 794 34.9
Germany 781 -17.2
Denmark 540 43.7
France 423 12.7
Canada 373 -46.8
Finland 361 5.7
Lithuania 298 -6.7
Italy 297 -12.2
Belgium 296 2.3
Greece 238 -5.4
Australia 182 9.5
Ireland 148 41.2
Hungary 116 55.2
Estonia 92 23.4
Austria 88 46.1
United Kingdom 58 15.4
Latvia 54 56.4
Sweden 32 10.2
Slovenia 25 74.4
Cyprus 23 19.1
Portugal 22 112.0
Czech Republic 18 32.5
Croatia 10 -36.6
Slovakia 8 31.7
Romania 7 27.3
Bulgaria 6 36.1
Luxembourg 0 n/a
Malta - n/a