By the Numbers

Saudi Arabia crude oil production outage affects global crude oil and gasoline prices
AJOT | September 23, 2019 | Energy | By The Numbers
On Saturday, September 14, 2019, an attack damaged the Saudi Aramco Abqaiq oil processing facility and the Khurais oil field in eastern Saudi Arabia.
FTR Trucking Conditions Index for July improved to a reading above neutral
AJOT | September 19, 2019 | Intermodal | Trucking | By The Numbers
FTR’s Trucking Conditions Index for July improved slightly to a just above neutral reading of 0.28. Lower diesel prices offset the effects of lower capacity utilization pushing the reading into positive territory for the first time since January.

Demand dips after Dorian
AJOT | September 18, 2019 | Intermodal | Trucking | By The Numbers
Truckload markets sprang into action as Hurricane Dorian attacked the East Coast. But since the storm passed, so too has the urgency to move freight. Last week load-to-truck ratios fell for vans and reefers, but reconstruction efforts boosted flatbed demand. The charts below show the national average rates for the month to date, including fuel surcharges. Explore Trendlines for more information.
Wind energy lifts Great Lakes shipping in August
AJOT | September 17, 2019 | Energy | Ports & Terminals | Canal and Waterway | By The Numbers
The St. Lawrence Seaway reported gains in traditional and project cargo for the month of August. Year-to-date total cargo shipments for the period from March 22, 2019 through August 31, 2019 were 20.9 million metric tons, a decrease of just over 3 percent compared to 2018.

U.S. Great Lakes ports report busy August
AJOT | September 17, 2019 | Ports & Terminals | Canal and Waterway | By The Numbers
Despite these areas of strength, cargo volumes via the bi-national St. Lawrence Seaway (from March 22 to August 31) at 20.9 million metric tons were down 3.5 percent compared to the same period in 2018.
First indication of air cargo trend in August 2019
AJOT | September 17, 2019 | Air Cargo | General | By The Numbers
In a WorldACD Trends message two weeks ago, they reported Year-on-Year (YoY) growth for chargeable weight of -4.2% for July 2019.

Underwriters take action to address continuing unprofitability
AJOT | September 17, 2019 | Maritime | Liner Shipping | By The Numbers
Speaking at today's IUMI annual conference in Toronto, Canada, Sean Dalton, Chair of IUMI's Cargo Committee reported a 2.5% increase in 2018 global premiums to USD 16.6 billion.

EIA releases plant-level U.S. biodiesel production capacity data
AJOT | September 16, 2019 | Energy | By The Numbers
On September 13, the U.S. Energy Information Administration (EIA) released its first annual U.S. Biodiesel Plant Production Capacity Report.
U.S. Census Bureau: Manufacturing and Trade Inventories and Sales
AJOT | September 16, 2019 | International Trade | By The Numbers
U.S. total business end-of-month inventories for July 2019 were $2,042.6 billion, up 0.4 percent (+/- 0.1 percent) from last month. U.S. total business sales were $1,462.9 billion, up 0.3 percent (+/-0.1 percent) from last month. July 2019: +0.4 % change in Inventories June 2019 (r): 0.0* % change in Inventories (*) The 90% confidence interval includes zero. The Census Bureau does not have sufficient statistical evidence to conclude that the actual change is different from zero. (°) Statistical significance is not applicable or not measurable for these surveys. The Manufacturers’ Shipments, Inventories and Orders estimates are not based on a probability sample, so we can neither measure the sampling error of these estimates nor compute confidence intervals. (r) Revised.

Truckload linehaul rates go negative
AJOT | September 16, 2019 | Intermodal | Trucking | By The Numbers
After more than two years of year-over-year increases in truckload linehaul rates, the Cass Truckload Linehaul Index® went negative in August (-2.6%). It also fell 6.9% sequentially.

Coal shipments to the U.S. power sector continue to fall
AJOT | September 13, 2019 | Energy | By The Numbers
According to the U.S. Energy Information Administration (EIA) power sector surveys, more than 75% of the coal delivered to the power sector last year was shipped either completely or in part by rail; the remainder was shipped by river barge, truck, and other methods.

Natural gas-fired power generation has grown in Florida, displacing coal
AJOT | September 09, 2019 | Energy | By The Numbers
Florida added nearly 16 gigawatts (GW) of utility-scale natural gas-fired electric generation between 2008 and 2018, about one-quarter (24%) of all U.S. natural gas installations during this time and the most of any state.

Permian gas flaring drops for the first time in years
AJOT | September 04, 2019 | Energy | By The Numbers
Flaring of gas in the Permian Basin in the US in the first quarter of 2019 dropped for the first time in 1.5 years, according to Rystad Energy.
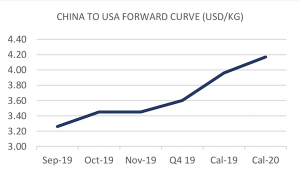
FIS Air Freight Report September 2, 2019
AJOT | September 03, 2019 | By The Numbers
China to Europe spot rates continue to sink beyond the August levels, with the basket dropping a further 3 cents. This softening has since lost momentum over the past few weeks, with the forward market pricing in a slower price rise at the end of Q3. Q4 is still uncertain, with forward market trading activity unlikely to build until the end of September.
Dreary: Reefer container equipment availability to remain tight
AJOT | September 03, 2019 | Maritime | Liner Shipping | By The Numbers
Reefer container equipment availability will remain tight over the next few years which will impact shipping capacity supply and freight rates at seasonal peaks, according to Drewry’s latest Reefer Shipping Annual Review and Forecast 2019/20 report, published this month.

DAT: Pricing remains stable in late summer
AJOT | September 03, 2019 | By The Numbers
Truckload rates remained stable on the spot market, with gains and losses largely offsetting each other across the country. Load-to-truck ratios fell for vans, reefers, and flatbeds, but that trend could reverse as we approach Labor Day.

Average U.S. construction costs for solar generation continue to decrease
AJOT | September 03, 2019 | Energy | Alternative | By The Numbers
According to 2017 data from the U.S. Energy Information Administration (EIA) for newly constructed utility-scale electric generators in the United States, annual capacity-weighted average construction costs for solar photovoltaic systems continued to decrease.

U.S. retail gasoline prices heading into Labor Day are lower than last year
AJOT | August 30, 2019 | Energy | By The Numbers
The U.S. average retail price for all formulations of regular gasoline on August 26, 2019, was $2.57 per gallon (gal), 25 cents/gal (9%) lower than the price at the same time last year. This

Corn crop maturity suggests late harvest and high heating fuel demand this winter
AJOT | August 30, 2019 | Energy | By The Numbers
Although crops are still about two months away from harvest, the combination of expected wet, late corn crops; relatively high grain prices; and relatively low propane prices suggest strong propane demand during this year’s grain drying season.
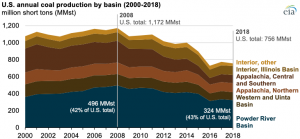
Sixteen mines in the Powder River Basin produce 43% of U.S. coal
AJOT | August 26, 2019 | By The Numbers
U.S. annual coal production by basin Source: U.S. Energy Information Administration and U.S. Mine Safety Health Administration (MSHA) More than 40% of coal produced in the United States comes from 16 mines in the Powder River Basin (PRB), a mining region primarily located in northeast Wyoming and southeast Montana. Four companies collectively own more than half of those PRB mines, and those 10 mines produced 87% of the Basin’s coal in 2018. Two of those companies, Cloud Peak and Blackjewel, filed bankruptcy this year. The two other companies, Peabody and Arch Coal, are proposing a joint venture that involves some of the PRB mines. Powder River Basin coal production by mine owner affiliation and individual mine Source: U.S. Energy Information Administration and U.S. Mine Safety Health Administration (MSHA) Most of the coal produced in the PRB supports electric power generation in the United States. Starting in the 1990s, many coal-fired power plants switched to subbituminous coal from the PRB—which has relatively low sulfur content—to meet tightening Clean Air Act emission standards. By 2003, the Powder River Basin yielded more coal than the Appalachian coal basins in the eastern United States. Both U.S. total coal production and PRB coal production peaked in 2008 and have since declined. PRB coal production reached a high of 496 million short tons (MMst) in 2008 and fell to 314 MMst in 2016 but has since increased slightly to 324 MMst in 2018. Coal use in the U.S. electric power sector has decreased as overall electricity demand has remained relatively flat and other fuels—particularly natural gas and renewables—have gained market share. Coal’s share of the U.S. electricity generation mix was 48% in 2008 and has since fallen to 28% in 2018. The U.S. Energy Information Administration’s (EIA) Short-Term Energy Outlook expects coal’s share of power generation to be 24% in both 2019 and 2020. EIA forecasts that coal production in the Western region, which includes PRB coal as well as coal production in the Rocky Mountains, will decline by 12% in 2019. Declines in domestic coal consumption had been partially offset by rising demand for coal in export markets. Although most U.S. coal exports are bituminous coal (used for steelmaking), the United States has exported growing volumes of subbituminous coal from PRB mines to Asian countries for coal-fired power plants. However, these volumes are relatively small—the United States exported 7.7 MMst of subbituminous coal in 2018, accounting for 7% of total U.S. coal exports and 2% of total PRB coal production. Powder River Basin coal production and productive capacity Source: U.S. Energy Information Administration, Form EIA-7A, Annual Survey of Coal Production and Preparation, and U.S. Mine Safety Health Administration (MSHA) Coal mines in the PRB are only using about two-thirds of their productive capacity. Productive capacity refers to the amount of coal that mines could produce each year with their existing equipment. PRB coal productive capacity peaked in 2010 at 575 MMst and has since declined to 476 MMst in 2018. annueal average Powder River Basin coal price Source: U.S. Energy Information Administration and S&P Global Prices for PRB coal have exhibited little volatility in the past decade. In 2008, the average annual selling price for PRB coal with a heating value of 8,800 British thermal units per pound was $13.31 per short ton, compared with $12.31 per short ton in 2018. Transportation rates to deliver coal from PRB mines to power plants, mostly by railroad, now account for nearly two-thirds of the total delivered cost of the coal, compared with 56% in 2008. Principal contributors: Rosalyn Berry, Mark Morey
Upcoming Events
Latest Print Edition:

- Intermodal and North American Rail Operations
- Europe Ports and Trade
- Labor Day 2024
- China Ports and Trade
© Copyright 1999–2024 American Journal of Transportation. All Rights Reserved