In December, volatility - both in volumes and in rates - has been the order of the day in many markets in 2020. Today, we can present you the figures underlying that statement, by comparing the full year 2020 with 2019, looking at air cargo from a number of different angles. But before doing so, let us take a quick look at the closing month of this very memorable year in our ‘industry’.
December gave reason for cheer, with a worldwide year-on-year (YoY) weight change of only -3.7%, still below December 2019, but the first weight change percentage in single digits since February. In other words: a return to normalcy? Yes and no, as rates per kg continued to show the stunning growth level that made 2020 such an extraordinary year. They increased by more than 80%, from USD 1.80 to USD 3.27, the highest YoY rate increase since May… For the first time since March, there were origin regions showing YoY volume growth, modest though they were: Asia Pacific +0.2% and North America +2.1%. The first indications for January showed a considerable drop in rates: the weekly yields started to drop by mid-December, and by mid-January they had fallen by almost 10%.
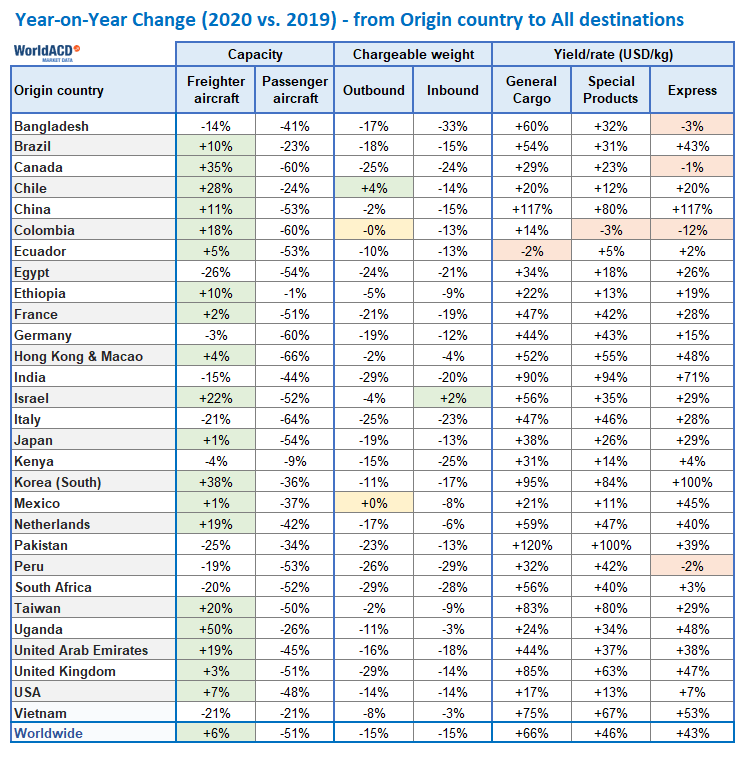
So now on to the changes in 2020. We looked at the largest markets in each of the six regions Africa, Asia Pacific, Central & South America, Europe, the Middle East & South Asia and North America. The results vs 2019 are shown in the tables below.