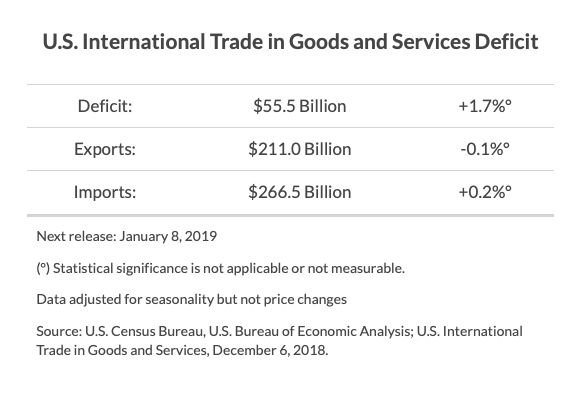
The U.S. Census Bureau and the U.S. Bureau of Economic Analysis announced today that the goods and services deficit was $55.5 billion in October, up $0.9 billion from $54.6 billion in September, revised.
Exports, Imports, and Balance
October exports were $211.0 billion, $0.3 billion less than September exports. October imports were $266.5 billion, $0.6 billion more than September imports.
The October increase in the goods and services deficit reflected an increase in the goods deficit of $0.9 billion to $78.1 billion and a decrease in the services surplus of $0.1 billion to $22.6 billion.
Year-to-date, the goods and services deficit increased $51.3 billion, or 11.4 percent, from the same period in 2017. Exports increased $149.3 billion or 7.7 percent. Imports increased $200.6 billion or 8.4 percent.
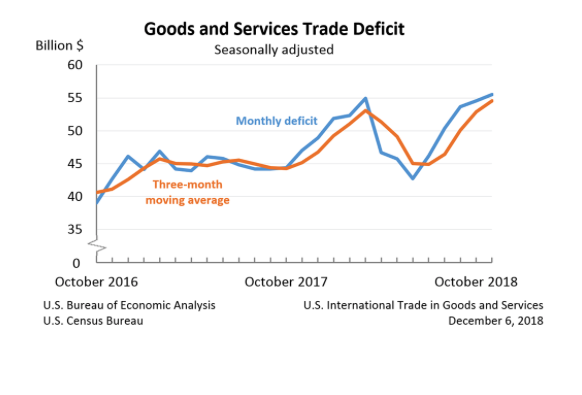
Three-Month Moving Averages
The average goods and services deficit increased $1.7 billion to $54.6 billion for the three months ending in October.
- Average exports increased $0.4 billion to $210.2 billion in October.
- Average imports increased $2.1 billion to $264.8 billion in October.
Year-over-year, the average goods and services deficit increased $9.4 billion from the three months ending in October 2017.
- Average exports increased $12.7 billion from October 2017.
- Average imports increased $22.1 billion from October 2017.
Exports
Exports of goods decreased $0.4 billion to $141.5 billion in October.
Exports of goods on a Census basis decreased $0.4 billion.
- Foods, feeds, and beverages decreased $0.7 billion.
- Soybeans decreased $0.8 billion.
Capital goods decreased $0.5 billion.
- Civilian aircraft engines decreased $0.3 billion.
- Civilian aircraft decreased $0.3 billion.
Other goods increased $0.5 billion.
Industrial supplies and materials increased $0.3 billion.
Net balance of payments adjustments increased less than $0.1 billion.
Exports of services increased $0.1 billion to $69.6 billion in October.
- Financial services increased $0.1 billion.
- Other business services, which includes research and development services; professional and management services; and technical, trade-related, and other services, increased $0.1 billion.
- Transport decreased $0.1 billion.
Imports
Imports of goods increased $0.5 billion to $219.6 billion in October.
Imports of goods on a Census basis increased $0.3 billion.
Consumer goods increased $2.0 billion.
- Pharmaceutical preparations increased $1.5 billion.
Other goods increased $0.8 billion.
Automotive vehicles, parts, and engines increased $0.7 billion.
Capital goods decreased $3.2 billion.
- Telecommunications equipment decreased $1.0 billion.
- Computer accessories decreased $0.8 billion.
- Computers decreased $0.7 billion.
Net balance of payments adjustments increased $0.2 billion.
Imports of services increased $0.2 billion to $46.9 billion in October.
Travel (for all purposes including education) increased $0.2 billion.
Real Goods in 2012 Dollars – Census Basis
The real goods deficit increased $0.6 billion to $87.9 billion in October.
- Real exports of goods decreased $1.2 billion to $149.6 billion.
- Real imports of goods decreased $0.5 billion to $237.5 billion.
Revisions
Exports and imports of goods and services were revised for April through September 2018 to incorporate more comprehensive and updated quarterly and monthly data.
Revisions to September exports
- Exports of goods were revised up less than $0.1 billion.
- Exports of services were revised down $1.2 billion.
Revisions to September imports
- Imports of goods were revised up less than $0.1 billion.
- Imports of services were revised down $0.7 billion.
Goods by Selected Countries and Areas: Monthly – Census Basis
The October figures show surpluses, in billions of dollars, with South and Central America ($3.7), Hong Kong ($2.4), Brazil ($0.7), and Singapore ($0.6). Deficits were recorded, in billions of dollars, with China ($38.2), European Union ($15.1), Mexico ($6.4), Germany ($5.8), Japan ($5.5), Italy ($2.7), OPEC ($2.3), Canada ($2.0), India ($2.0), Saudi Arabia ($1.8), South Korea ($1.8), Taiwan ($1.2), France ($1.1), and United Kingdom (less than $0.1).
- The deficit with the European Union increased $0.9 billion to $15.1 billion in October. Exports decreased $0.9 billion to $26.3 billion and imports decreased less than $0.1 billion to $41.3 billion.
- The deficit with China increased $0.7 billion to $38.2 billion in October. Exports decreased $2.6 billion to $7.6 billion and imports decreased $1.9 billion to $45.7 billion.
- The deficit with Mexico decreased $1.2 billion to $6.4 billion in October. Exports decreased $0.1 billion to $22.4 billion and imports decreased $1.3 billion to $28.8 billion.
Goods and Services by Selected Countries and Areas: Quarterly – Balance of Payments Basis
Statistics on trade in goods and services by country and area are only available quarterly, with a one-month lag. With this release, third-quarter figures are now available.
The third-quarter figures show surpluses, in billions of dollars, with South and Central America ($20.6), Hong Kong ($7.7), Brazil ($7.1), Singapore ($4.2), and United Kingdom ($3.7). Deficits were recorded, in billions of dollars, with China ($95.9), European Union ($30.2), Mexico ($21.6), Germany ($16.3), Japan ($13.4), Italy ($8.8), India ($5.7), France ($3.8), Canada ($2.7), South Korea ($2.2), Taiwan ($2.0), Saudi Arabia ($2.0), and OPEC ($0.9).
- The deficit with China increased $10.3 billion to $95.9 billion in the third quarter. Exports decreased $3.1 billion to $46.0 billion and imports increased $7.2 billion to $141.9 billion.
- The deficit with the European Union increased $6.3 billion to $30.2 billion in the third quarter. Exports decreased $2.0 billion to $143.2 billion and imports increased $4.2 billion to $173.4 billion.
- The deficit with Japan decreased $1.9 billion to $13.4 billion in the third quarter. Exports increased $0.5 billion to $30.4 billion and imports decreased $1.5 billion to $43.7 billion.