Steady as We Go
| March 2024 | Year-over-year change | 2-year stacked change | Month-to-month change | Month-to-month change (SA*) | |
| Cass Freight Index - Shipments | 1.113 | -3.6% | -7.5% | -0.2% | -2.3% |
| Cass Freight Index - Expenditures | 3.227 | -18.5% | -28.3% | 0.1% | -1.3% |
| Cass Inferred Freight Rates | 2.899 | -15.4% | NA | 0.2% | 1.0% |
| Truckload Linehaul Index | 140.83 | -4.7% | -13.8% | 0.2% | NA |
* SA = seasonally adjusted
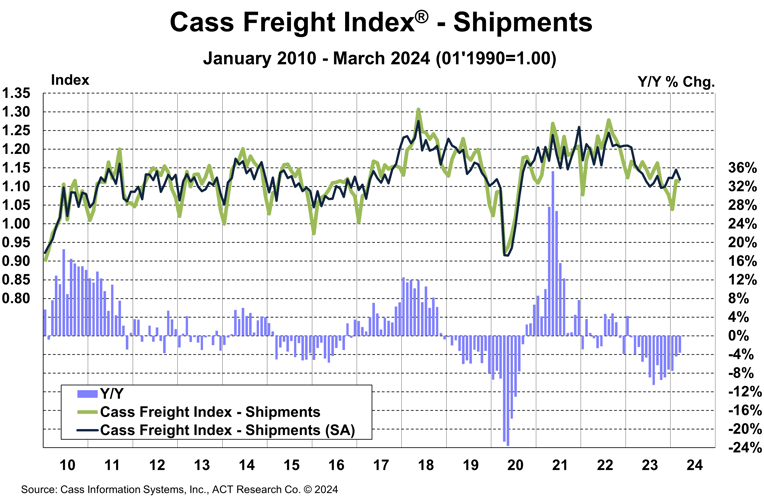
Cass Freight Index - Shipments
The shipments component of the Cass Freight Index® fell 0.2% m/m in March, as for-hire demand remains broadly consistent. The index fell 2.3% m/m in seasonally adjusted (SA) terms, giving back the 2.0% m/m increase in February from Leap Day.
- Underlying volumes did show improvement in Q1, as the shipments component of the Cass Freight Index rose about 2% from Q4’23 in SA terms.
- The 3.6% y/y decline was the smallest in a year, and although freight demand is broadly better than the for-hire market, it’s still hard to see amid ongoing private fleet growth.
After rising 0.6% in 2022, the index declined 5.5% in 2023. With normal seasonality, the index will fall 2%-3% y/y in April and turn positive y/y in June.
See the Methodology for the Cass Freight Index
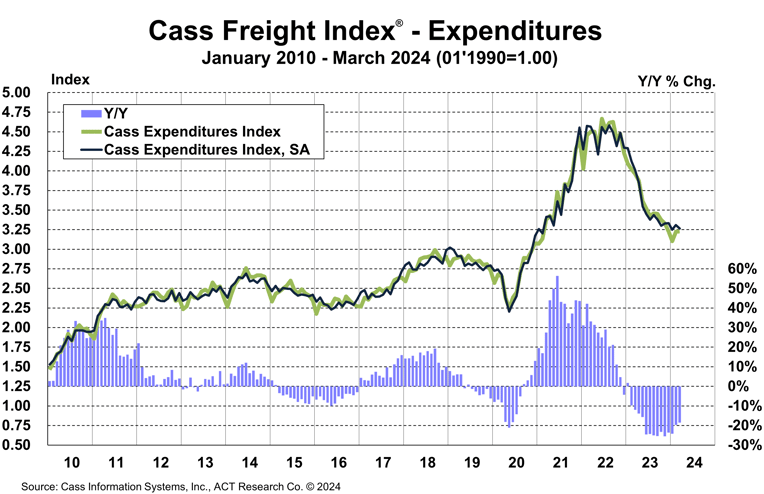
Cass Freight Index - Expenditures
The Expenditures component of the Cass Freight Index, which measures the total amount spent on freight, rose 0.1% m/m, but fell 18% y/y in March.
With shipments down 0.2% m/m, we infer rates were up 0.2% m/m in February (see our inferred rates data series below).
- The index fell 1.3% m/m (SA), with shipments down 2.3% and rates up 1.0%.
This index includes changes in fuel, modal mix, intramodal mix, and accessorial charges, so is a bit more volatile than the cleaner Cass Truckload Linehaul Index®.
U.S. freight spending, as measured by the expenditures component of the Cass Freight Index, fell 19% in 2023, after a record 38% surge in 2021 and another 23% increase in 2022. It is set to decline about another 14% in 1H’24, assuming normal seasonal patterns from here, and 9% for the full year.
Inferred Freight Rates
The rates embedded in the two components of the Cass Freight Index declined 15% y/y in March and have now declined 15%-21% for ten straight months.
- Cass Inferred Freight Rates rose 1.0% m/m SA from what increasingly looks like a floor.
- Based on the normal seasonal pattern, this index would rise m/m in April, with the y/y decline moderating to the low teens.
The normal seasonal pattern from here would put inferred rates down 8% for the full year. Even if rates begin moving higher from here, as is increasingly likely, freight will very likely remain deflationary this year.
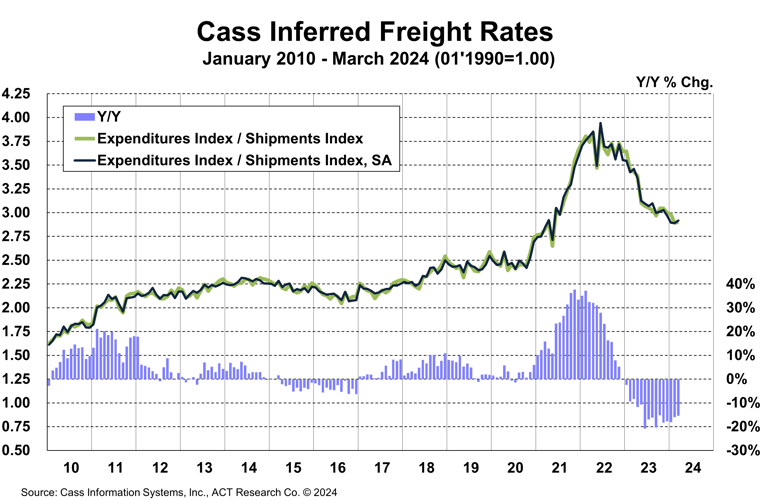
Cass Inferred Freight Rates are a simple calculation of the Cass Freight Index data—expenditures divided by shipments—producing a data set that explains the overall movement in cost per shipment. The data set is diversified among all modes, with truckload (TL) representing more than half of the dollars, followed by less-than-truckload (LTL), rail, parcel, and so on.
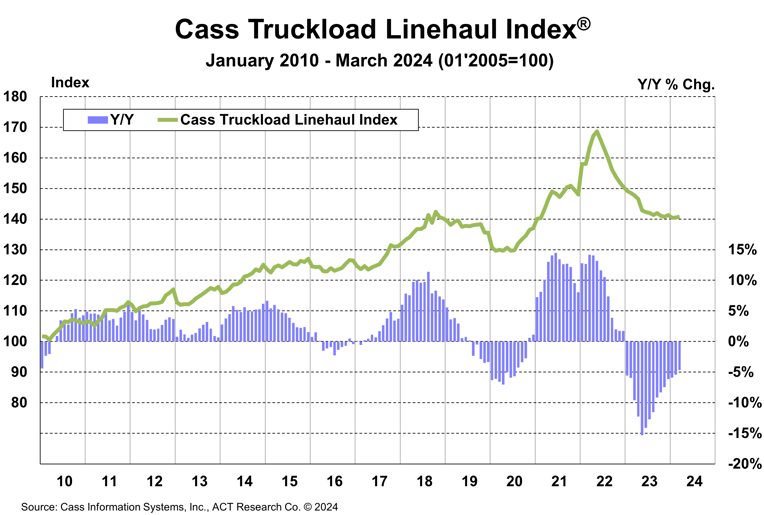
Truckload Linehaul Index
Stability continued for the Cass Truckload Linehaul Index in March, with a 0.2% m/m increase after a 0.1% m/m increase in February. The 4.7% y/y decline continued to gradually narrow.
- The index has been in a very tight range, from 140.4 to 142.0, over the past nine months as the market finds a floor.
- As a broad truckload market indicator, this index includes both spot and contract freight. With spot rates steady over the past several months, downward pressure on the larger contract market is lessening, with some instances of contract rate increases bucking the downtrend recently.
See the Methodology for the Cass Truckload Linehaul Index
Freight Expectations
Outlook Starting to Brighten. The tragic Baltimore bridge collapse caused major logistical challenges but is unlikely to significantly affect the freight market balance. Given Baltimore’s importance as a roll-on/roll-off (Ro/Ro) port for machinery and autos, spot flatbed rates have risen at ports near Baltimore and for loads heading into the Baltimore area, where backhauls are currently tougher to find.
While a freight channel might open sooner, it looks like the port will be largely closed to container traffic through May, and the bridge will take years to rebuild. But the highway system is pretty resilient overall, and the bigger underlying supply and demand trends in the spot market were strongly suggesting higher rates in Q2, even before this (typically inflationary) loss of capacity.
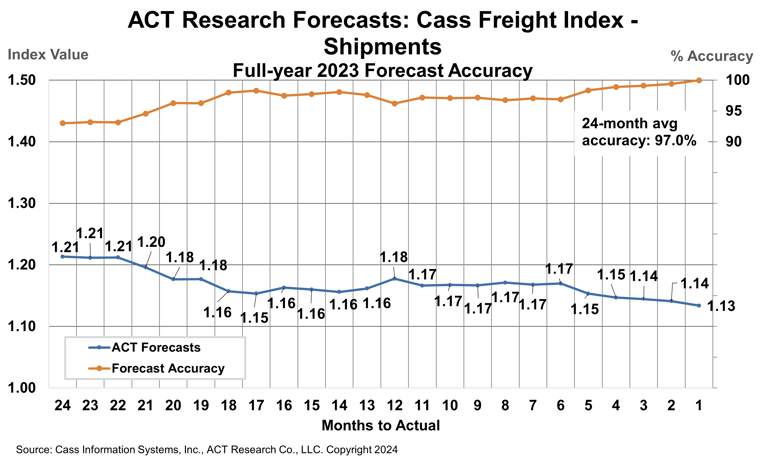
Our outlook through 2026 is detailed in the ACT Research Freight Forecast. This service provides in-depth analysis and forecasts for a broad range of U.S. freight measures, including the Cass Freight Index, Cass Truckload Linehaul Index, and DAT spot and contract rates by trailer type, LTL, and intermodal price indexes. ACT Research provides monthly, quarterly, and annual predictions for over 40 data series over a two- to three-year time horizon, including capacity, volumes, and rates. The Freight Forecast is released monthly in conjunction with the Cass Transportation Index report.
How have ACT Research’s freight forecasts performed? For 2023, ACT’s forecasts for the shipments component of the Cass Freight Index were 96.9% accurate on average for the 24-month forecast period.
(As a reminder, ACT Research’s Tim Denoyer writes this report.)
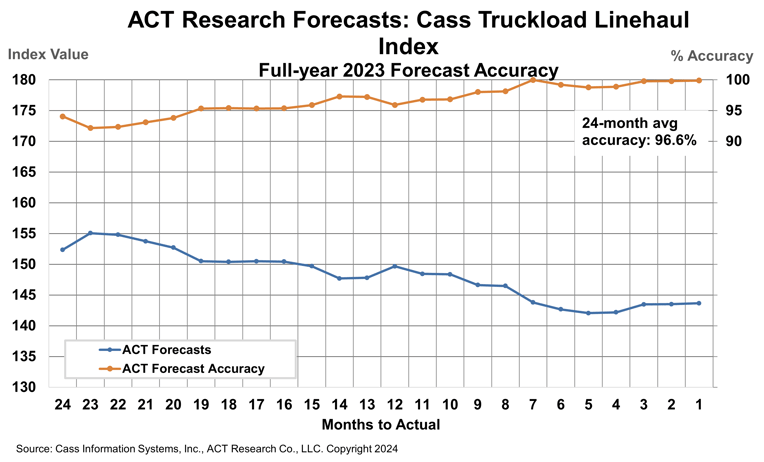
ACT Research’s 2023 forecasts for the Cass Truckload Linehaul Index were 96.6% accurate on average over the past 24 months, and 98.5% accurate over the past 12 months. The Cass Truckload Linehaul Index averaged 143.8 in 2023, precisely in line with our July 2023 estimate.
Release date: We strive to release our indexes on the 13th of each month. When this falls on a Friday or weekend, our goal is to publish on the next business day.