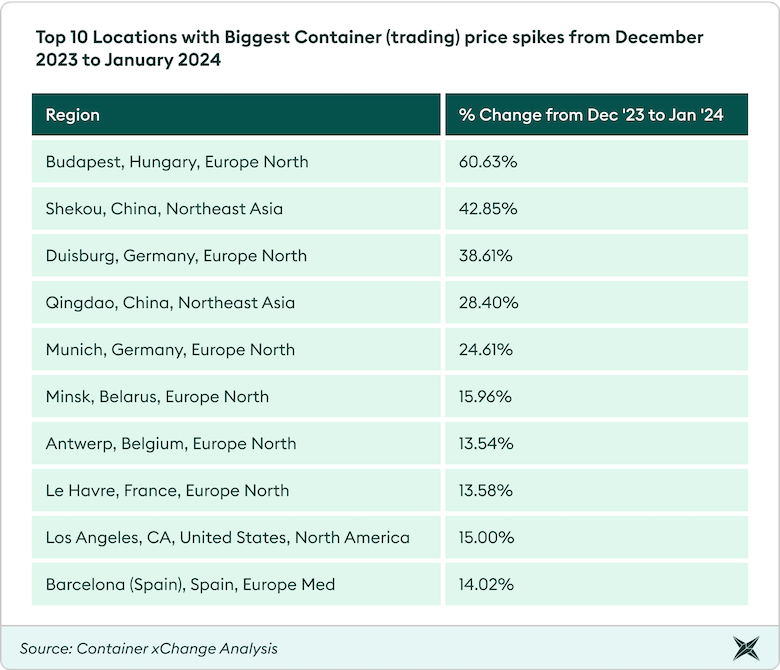
- Average container trading prices surge by up to 60% in January’24
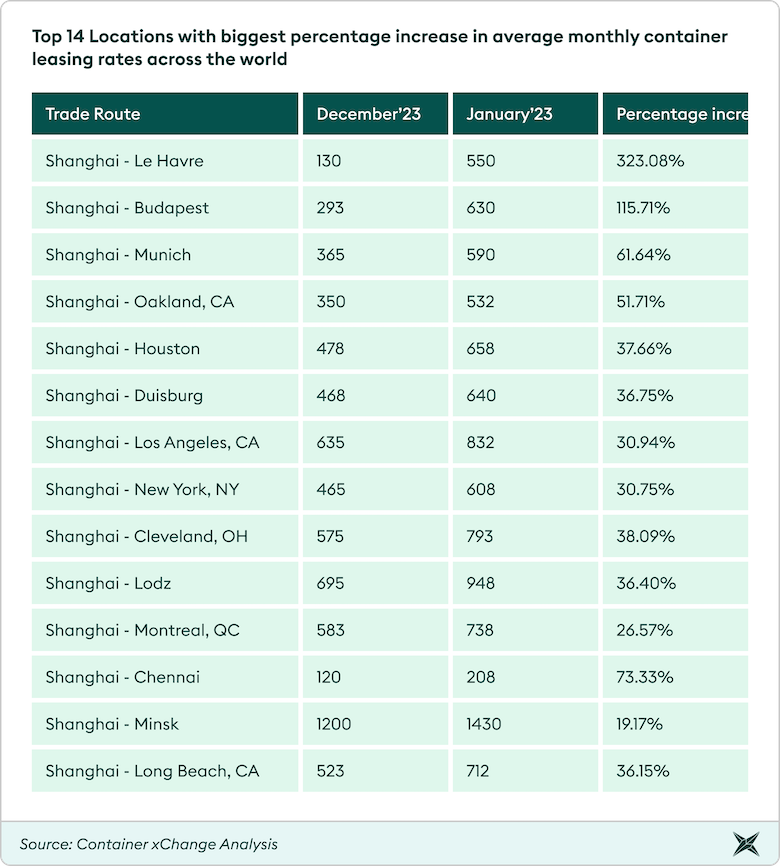
- Container leasing rates Ex China rise by up to 323%
- Supply Chain professionals expect Container prices to surge further in February: xCPSI (Container Price Sentiment Index by Container xChange)
In response to the escalating Red Sea crisis, Container xChange, leading online container logistics platform, has released a comprehensive report detailing the far-reaching effects on container trading and leasing rates worldwide. The report explores the intricate dynamics of the crisis, shedding light on the unprecedented surge in container prices and leasing rates, as well as the ripple effect on global trade routes.
- Impact of Red Sea Attacks on Container Prices
As container vessels take longer routes, capacity constraints contribute to a revival in container rates. The China to Europe trade lane has witnessed significant surges, with trading spot rates soaring in key Chinese ports. The disruptions are not confined to China; leasing rates bound for Hamburg, Germany have doubled since January 1, 2024.
To provide context on the current state of average container prices in Shanghai, China, in comparison to the peak demand period during the COVID-19 pandemic (2021), we present a chart illustrating the price trends from 2020 to January 29, 2024. The container prices skyrocketed to historic levels in 2021 due to the pent-up demand post COVID, reaching a peak of $6171 in the last week of September 2021, and falling since then until December 2023 (keeping aside minor seasonal hikes). However, container prices have experienced a significant increase since the beginning of January 2024.

Weekly China – Europe Trading spot rates continue to shoot up
Trading spot rates for 40ft high cube cargo-worthy containers have witnessed a significant surge in key Chinese ports. Noticeable week-on-week increases have been recorded in Xiamen (23%), Shekou (19%), Guangzhou (10%), Huangpu (8%), and Nansha (8%). These disruptions are not confined to China; leasing rates bound for Hamburg, Germany have doubled since January 1st, 2024.
“Since the beginning of the Houthi situation, the trading prices for 40 ft high cube units in China significantly increased because there is expected tightness around equipment availability in Chinese main ports ahead of Chinese New Year because the loop around Africa soaks up capacity and delays the return of empty equipment to China.” commented Christian Roeloffs, cofounder and CEO of Container xChange.
“At present, there is still surplus in the market. However, the challenge lies in securing space on vessels, and the PUCs (pickup charges) are considerably high. The suppliers are hesitant to reposition their containers to locations with elevated storage fees, and if they do, they often seek to offset these costs by demanding higher PUC.” the customer added.
A Container xChange customer from India added, “Storage charges in India are inexpensive. Consequently, some NVOCC opt to utilize containers from other companies rather than moving their own.”
Container xChange's research indicates a global impact on container trading prices, with the top 10 locations experiencing substantial month-on-month percentage increases. European ports like Le Havre, France, and Duisburg, Germany, witnessed significant decreases, while ports in North America showed mixed results. Meanwhile, Asian ports, including Shanghai, China, and Xiamen, China, saw an increase in average container prices, indicating adaptation to disruptions.
2. Container Leasing Rates continue to rise
Container leasing spot rates have mirrored the spikes observed in trading prices, especially in the China to Europe route. Rates have steadily increased, reaching notable highs. The expected continuation of disruptions indicates a prolonged period of challenges, requiring industries to adapt to structural imbalances in supply and demand.
"We've witnessed a continuous surge in leasing rates since around August-September 2023, starting at a low of approximately $200 for a one-way move from Ningbo or Shanghai to Hamburg, often referred to as pickup charges. This escalation is primarily driven by two key factors. Firstly, the widening price gap in trading prices has played a pivotal role, and secondly, there's a notable equipment scarcity across China. As the price gap widens and equipment availability tightens, the spike has become more evident since the beginning of 2024. It's clear that the attacks in the Red Sea are not merely a passing phenomenon; they have substantial implications on the routing of container vessels, causing delays in their return trips to China. We have witnessed this surge to top at $800 for a one-way move, marking a fourfold increase." - Christian Roeloffs, Co-founder, and CEO of Container xChange.
“We do expect that after Chinese New Year the situation will decelerate and easen up owing to the drop in demand, carriers will be able to reconfigure their network and adjust to the longer transit times around the cape of good hope and are supposed to have a structural supply demand imbalance with a significance supply overhang.” Roeloffs added.
“The situation is expected to persist for a longer than expected period of time and hence, we will probably have to live with this for a long time. Concluded Roeloffs.
Top Trade routes with highest month-on-month rate hikes
In the period from January 1 to January 30, 2024, leasing rates for routes bound to Hamburg have shown a substantial increase. For example, Qingdao to Hamburg rates surged from $260 on January 1, 2024, to $1060 by January 30, 2024. Similarly, Shenzhen to Hamburg rates rose from $500 on January 1, 2024, to $750 by January 30, 2024. These figures highlight a significant upward trend in leasing rates during the specified timeframe, illustrating the impactful changes in the market.
Below is the list of the highest spikes noticed month on month from December 2023 to January 2024 across trade routes. The prices are the average leasing terms for SOCs (shipper owned containers) as observed on the Insights platform of Container xChange.
European Ports Experience Substantial Increases
Routes connecting Shanghai to European ports, such as Le Havre, Budapest, and Munich, witnessed some of the highest percentage increases. Le Havre, in particular, recorded an extraordinary surge of 323.08%. This indicates potential challenges in the European supply chain, possibly due to the longer alternative route and increased shipping costs.
Impact on Trans-Pacific Routes:
Routes to the West Coast of the United States, including Oakland, CA, Los Angeles, CA, and Long Beach, CA, experienced notable increases (ranging from 30.94% to 51.71%). The rise in leasing rates suggests that vessels rerouting around the Cape of Good Hope are facing higher costs, potentially due to increased travel distances and fuel consumption.
Significant Impact on Transatlantic Routes:
Routes connecting Shanghai to key North American cities like New York, NY, and Cleveland, OH, witnessed considerable percentage increases. This indicates that the disruption is affecting the traditional transatlantic trade routes, with potential repercussions for industries relying on timely deliveries between Asia and North America.
Mixed Impact on Asian Routes:
While routes to Chennai, India, experienced a substantial increase (73.33%), routes to Minsk, Belarus, showed a comparatively lower percentage rise (19.17%). This suggests variations in how disruptions affect different regions, possibly influenced by the nature of trade and supply chain dynamics.
3. Industries Impacted by Red Sea Turmoil
The longer disruptions at the Red Sea trade route pose a significant threat to various industries, including automobiles, electronics, chemicals, consumer goods, machinery, and pharmaceuticals. Delays in the supply chain could lead to production interruptions, impacting global value chains.
"Effectively navigating this critical period requires enhanced predictive analysis, meticulous demand forecasting, and increased collaboration within the industry. By employing advanced planning techniques and maintaining agility in response to evolving situations, the manufacturing sector can not only overcome immediate challenges but also strategically position itself for long-term success. Adapting to the new normal will involve holding increased inventory, accounting for extended transit times, and acknowledging higher container rates as integral components of the evolving landscape." explains Christian Roeloffs, Co-founder, and CEO of Container xChange.
The impact extends beyond individual industries to the broader economy, emphasizing the vulnerability of just-in-time manufacturing processes to disruptions. Businesses across sectors will need to closely monitor and adapt to evolving circumstances to ensure the continued flow of goods through alternative routes if necessary.
Outlook: January's Remarkably Positive Outlook on Container Price Development Amid Red Sea Turmoil
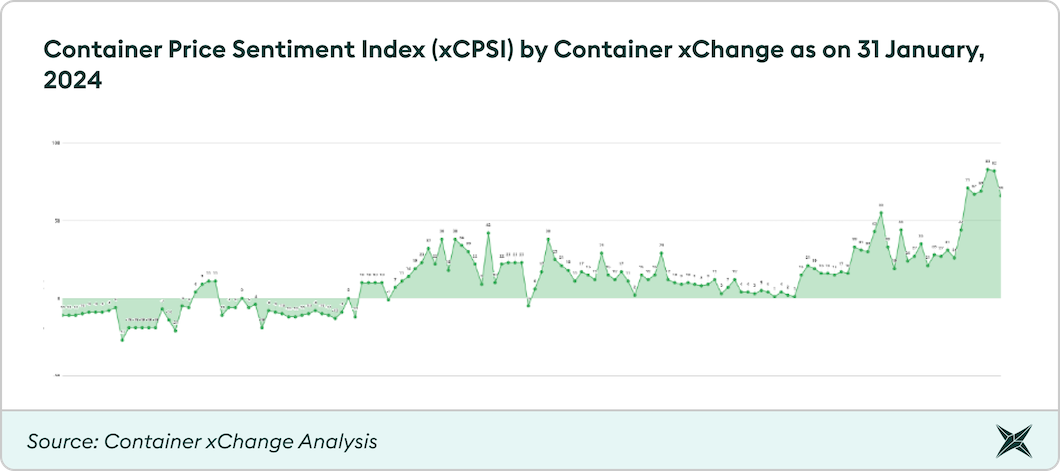
In January, the Container Price Sentiment Index (xCPSI) consistently maintained historically elevated levels, reflecting the widespread anticipation that container prices would continue to remain exceptionally high, owing to the Red Sea crisis.
Throughout January 2024, the Container Price Sentiment Index (xCPSI), proprietary container price sentiment tool by Container xChange, consistently maintained historically elevated levels, reflecting a widespread belief that container prices would continue to soar due to the ongoing Red Sea crisis. The industry anticipates sustained high prices, highlighting the profound impact of the crisis on global trade.
The industry's expectation for container prices to remain exceptionally high in the foreseeable future urges businesses to stay agile and vigilant in their planning amidst evolving global trade dynamics.