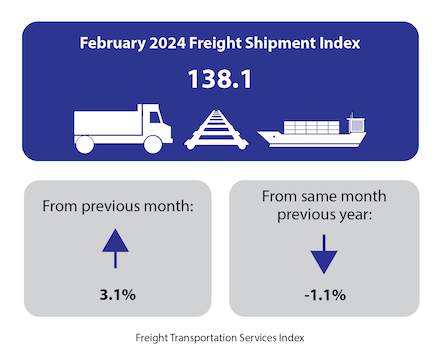
The Freight Transportation Services Index (TSI), which is based on the amount of freight carried by the for-hire transportation industry, rose 3.1% in February from January, rising for the first month after a one month decline, according to the U.S. Department of Transportation’s Bureau of Transportation Statistics’ (BTS). From February 2023 to February 2024 the index fell 1.1%.
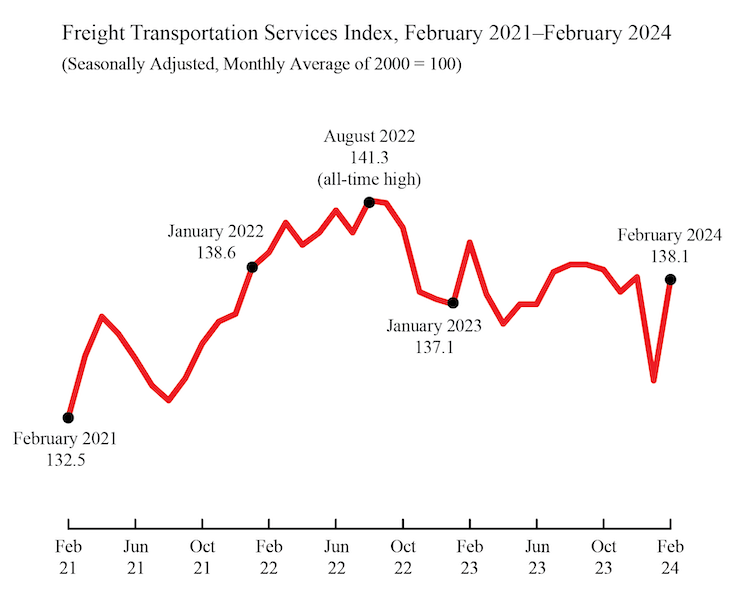
The level of for-hire freight shipments in February measured by the Freight TSI (138.1) was 2.3% below the all-time high of 141.3 reached in August 2022 (Table 2A). BTS’ TSI records begin in 2000.
The January index was revised to 134.0 from 134.1 in last month's release.
BTS will release the passenger and combined indexes for February next month, because air passenger travel continues to deviate from regular seasonal patterns, as it adjusts to the effects induced by the COVID-19 pandemic. The January passenger and combined indexes are available on the BTS website. Air freight for February is also a statistical estimate. Since air freight makes up a smaller part of the freight index, the freight TSI is being released as scheduled with the air freight estimate included.
The Freight TSI measures the month-to-month changes in for-hire freight shipments by mode of transportation in tons and ton-miles, which are combined into one index. The index measures the output of the for-hire freight transportation industry and consists of data from for-hire trucking, rail, inland waterways, pipelines and air freight. The TSI is seasonally-adjusted to remove regular seasonal movement, which enables month-to-month comparisons.
Analysis: The Freight TSI increased in February due to seasonally adjusted increases in trucking, air freight, rail carload, rail intermodal, and water while pipeline declined.
The February increase came in the context of positive results for several other indicators. The Federal Reserve Board Industrial Production (IP) Index grew by 0.1% in February, reflecting increases of 2.2% in mining and 0.9% in manufacturing, while utilities declined by 7.5%. Housing starts were up 10.7% while personal income increased by 0.3%.
The Institute for Supply Management Manufacturing (ISM) index was down 1.3 points to 47.8, indicating continued decline in manufacturing. A reading above 50 indicates an expansion of U.S. manufacturing, while a reading below 50 indicates a contraction.
Although the February Passenger TSI is being withheld because of the previously cited difficulty of estimating airline passenger travel and other components, the January index is now being released. The index decreased 2.8% from December to January. Seasonally adjusted transit and air passenger decline while rail passenger grew.
The Passenger TSI has now exceeded its level in March 2020 —the first month of the pandemic— for thirty-two months in a row but remains below its pre-pandemic level (February 2020) for the 47th consecutive month.
Trend: The February freight index increase was the largest increase since July 2020, a few months after the beginning of the COVID-19 pandemic. It followed a decrease in January, leaving the index 0.1% below its level in December 2023. The index increased 3.7% since August 2021. The February Freight TSI exceeds the pandemic low in April 2020 by 11.3%; the index increased month-over-month in 27 of the 46 months since that low.
Index highs and lows: For-hire freight shipments in February 2024 (138.1) were 45.4% higher than the low in April 2009 during the recession (95.0). The February 2024 level was 2.3% below the historic peak reached in August 2022 (141.3) (Table 1A).
Year to date: For-hire freight shipments measured by the index were down 0.1% in February compared to the end of 2023 (Table 3).
Long-term trend: For-hire freight shipments are up 1.0% in the five years from February 2019 and are up 16.8% in the 10 years from February 2014 (Table 5).
Same month of previous year: February 2024 for-hire freight shipments were down 1.1% from February 2023 (Tables 4, 5).
The TSI has three seasonally-adjusted indexes that measure changes from the monthly average of the base year of 2000. The three indexes are freight shipments, passenger travel and a combined measure that merges the freight and passenger indexes. TSI includes data from 2000 to the present. Release of the March 2024 index is scheduled for May 8, 2024.
Revisions: Monthly data has changed from previous releases due to the use of concurrent seasonal analysis, which results in seasonal analysis factors changing as each month’s data are added.
BTS research has shown a clear relationship between economic cycles and the Freight and Passenger Transportation Services Indexes.