Trading Update
A minor reversal on the previous week, all major aggregate and basket routes climb with single digit growth (the exception being Hong Kong to US, up 11 cents) in price movements linked to a squeeze prior to the early Chinese New Year. China to Europe is up 4 cents, China to USA up 8 cents with major Asia-US lanes showing much needed boosts after a disappointing retrospective market.
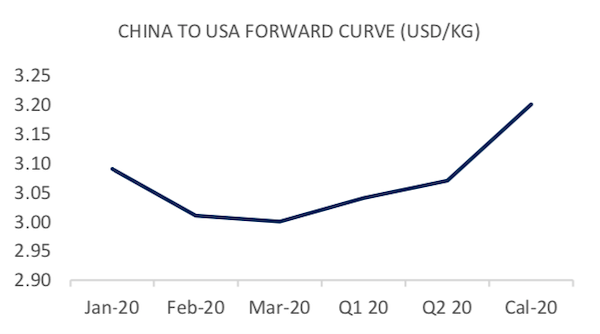
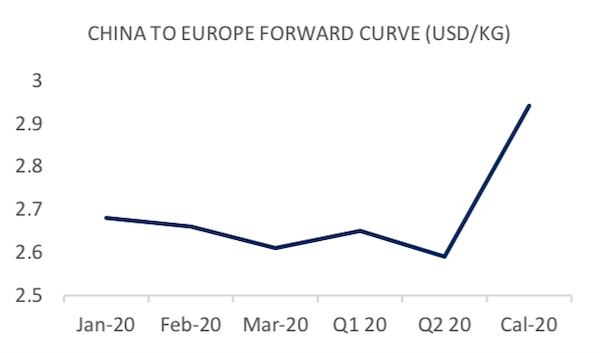
Forward curves show some minor corrections with China to Europe front month prices dropping off 1 cent only, with a further impact on Q1 forward price up 1 cent. China to US front month prices react to relatively positive spot rates, up 4 cents with an impact on Feb 2020 and Q1 2020, both up 1 cent each.
Market Comment
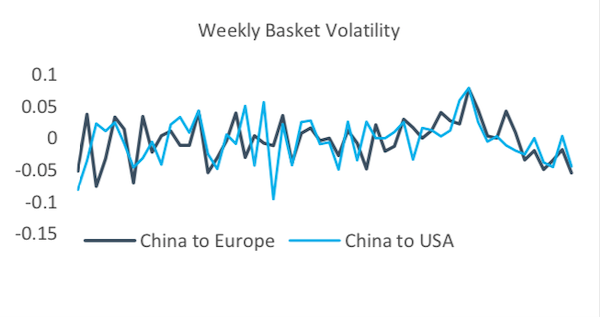
Whether a dead-cat bounce off of the back of Chinese New Year volumes, or a sign of things to come, the market is in the green and Hong Kong regains its lead over Shanghai to US with a positive spread of $0.06. Although not an awful lot can be taken from this, besides the over-riding prevalence of the unpredictability and volatility of this market - we are in the middle of RFQ season where the open market rate will start to matter for the bevy of long term contracts and contracted volumes over 2020.
Much of the price levels achievable by airlines will be subject to effective capacity management, something which has been highlighted recently with newly available cargo load factor and volume factor data. Encouragingly cargo load factors have been tracking flows in index prices for the past 12 months. More concerning for the market will be an impending battle for contract price between large air freight shippers and freight forwarders, which spills over into the overlying BSA market.
A few capacity providers are in contention this year, as airlines will use their forward BSA revenue to dictate their flight schedules. For some, 2020 will be a year to fight for survival in the hopes of a significant upturn in 2021. On the master co-loader front (and perhaps to the benefit of airlines) the external message has been 'business as usual' despite the significant losses incurred against BSAs in 2019. The nature of physical market speculation and trading might well be tested over 2021, and to coin a phrase generated in one of our other markets, "if you're not hedging, you're speculating".
| Basket | USD/KG | CHANGE | CHANGE % | MTD | VOL % |
| CHINA - EUR | 2.65 | 0.04 | 1.53% | 2.67 | 25.13% |
| CHINA - USA | 3.11 | 0.08 | 2.64% | 3.10 | 25.93% |
| Blended | USD/KG | CHANGE | CHANGE % | MTD | VOL % |
| PVG/EUR | 2.51 | 0.06 | 2.45% | 2.52 | 34.38% |
| HKG/EUR | 2.79 | 0.02 | 0.72% | 2.83 | 29.01% |
| PVG/US | 3.08 | 0.04 | 1.32% | 3.10 | 35.29% |
| HKG/US | 3.14 | 0.11 | 3.63% | 3.11 | 33.71% |
| Global | USD/KG | CHANGE | CHANGE % | MTD | VOL % |
| Air Index | 2.15 | 0.04 | 1.52% | 2.15 | 50.73% |
| Airfreight Route (AR) | Description | USD/KG | CHANGE | CHANGE % | MTD | VOL % |
| AGR 1 | HKG to LAX & ORD & JFK | 3.20 | 0.06 | 1.91% | 3.19 | 47.65% |
| AGR 2 | HKG to LHR & FRA & AMS | 2.80 | 0.12 | 4.47% | 2.78 | 41.19% |
| AGR 3 | HKG to SIN & BKK & PVG | 1.15 | -0.01 | -1.71% | 1.17 | 26.26% |
| AGR 4 | PVG to AMS & FRA & LHR | 2.53 | 0.06 | 2.43% | 2.53 | 56.66% |
Forward Curve - Indicative Update
| FIS AFFA, CHINA - EUROPE | USD/KG | ||||
| BID | ASK | VALUE | CHANGE | |
| Jan-20 | 2.62 | 2.74 | 2.68 | -0.01 |
| Feb-20 | 2.62 | 2.70 | 2.66 | 0.00 |
| Mar-20 | 2.53 | 2.69 | 2.61 | 0.00 |
| Q1 20 | 2.55 | 2.75 | 2.65 | -0.01 |
| Q2 20 | 2.58 | 2.70 | 2.59 | 0.00 |
| Cal-20 | 2.74 | 3.14 | 2.94 | 0.00 |
| FIS AFFA, CHINA - USA | USD/KG | ||||
| BID | ASK | VALUE | CHANGE | |
| Jan-20 | 3.04 | 3.14 | 3.09 | 0.04 |
| Feb-20 | 2.83 | 3.15 | 3.01 | 0.01 |
| Mar-20 | 3.16 | 3.24 | 3.00 | 0.00 |
| Q1 20 | 2.94 | 3.14 | 3.04 | 0.01 |
| Q2 20 | 3.10 | 3.12 | 3.07 | 0.00 |
| Cal-20 | 3.00 | 3.40 | 3.20 | 0.00 |