Both basket lanes from China to Europe and USA rebound slightly, climbing 2 and 8 cents respectively. Our market feedback marks this as reflective of short-term e-commerce demand from several major high-tech manufacturers.
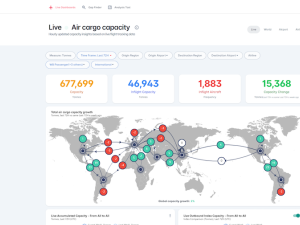
Trade wars and over-all slack import demand in North America and Europe have however confirmed a rate drop of 3 to 4% year on year, in line with a global divergence of cargo capacity and throughput.
TAC Index data has been strengthened by additional data suppliers, in addition to the opening of trans-Atlantic routes which are now viable for derivative contracts through FIS.
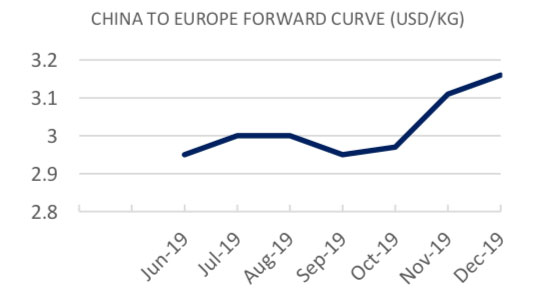
Forward Curve
The Freight Investor Services air cargo market report combines data from The Air Cargo (TAC) Index and perspectives from our wide array of clients to provide an view on the historical, present and future air cargo market. Constantly under review, market players can use the report to judge and assess air freight market volatility. The Forward Curve is an amalgamation of previous and prospective market data, weighted by live market information provided by our wide array of corporate clients. When trading an air cargo derivative, you can use the forward curve in conjuction with your own propriortory data to take a view as to where you think the market will turn next.
| Basket | USD/KG | CHANGE | CHANGE % | MTD |
| CHINA - EUR | 2.53 | 0.02 | 0.80% | 2.54 |
| CHINA - USA | 3.22 | 0.08 | 2.54% | 3.22 |
| Blended | USD/KG | CHANGE | CHANGE % | MTD |
| PVG/EUR | 2.44 | 0.15 | 6.52% | 2.43 |
| HKG/EUR | 2.59 | -0.11 | -4.03% | 2.66 |
| PVG/US | 3.06 | 0.26 | 8.90% | 3.04 |
| HKG/US | 3.38 | -0.10 | -2.97% | 3.39 |
'Airfreight routes (AGRs)' provide us with tradeable routes in conjunction with baskets, by maximising volumes along regional tradelanes. AGRs calculate the average of several correlating arrival points noted by their airport codes
| Airfreight Route (AR) | Description | PREVIOUS | USD/KG | CHANGE |
| AGR 1 | HKG to LAX & ORD & JFK | 3.32 | 3.13 | -5.72% |
| AGR 2 | HKG to LHR & FRA & AMS | 2.77 | 2.75 | -0.72% |
| AGR 3 | HKG to SIN & BKK & PVG | 1.18 | 1.23 | 4.24% |
| AGR 4 | PVG to AMS & FRA & LHR | 2.37 | 2.37 | 0.00% |
Forward Curve - Indicative Update
| HKG/CN - EUROPE AGGREGATE LANES - USD/KG | ||||
| BID | ASK | VALUE | CHANGE | |
| Jun-19 | 2.90 | 3.00 | 2.95 | 0.00 |
| Jul-19 | 2.95 | 3.05 | 3.00 | 0.00 |
| Aug-19 | 2.95 | 3.05 | 3.00 | 0.00 |
| Q3 19 | 2.90 | 3.00 | 2.95 | 0.00 |
| Cal - 19 | 3.04 | 3.14 | 3.09 | 0.00 |
| Cal - 20 | 3.44 | 3.54 | 3.49 | 0.00 |
HK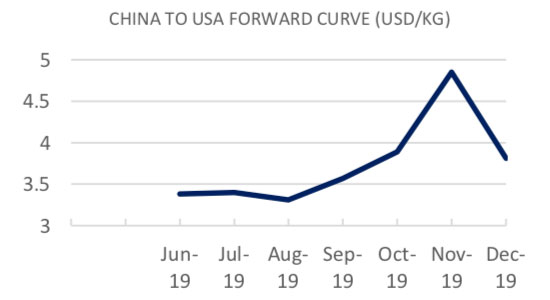 | ||||
| BID | ASK | VALUE | CHANGE | |
| Jun-19 | 3.33 | 3.43 | 3.38 | 0.00 |
| Jul-19 | 3.35 | 3.45 | 3.40 | 0.00 |
| Aug-19 | 3.26 | 3.36 | 3.31 | 0.00 |
| Q3 19 | 3.69 | 3.79 | 3.74 | 0.00 |
| Cal - 19 | 3.91 | 4.01 | 3.96 | 0.00 |
| Cal - 20 | 4.12 | 4.22 | 4.17 | 0.00 |