Fitch Ratings has affirmed the 'A+' rating on the Louisville Regional Airports Authority, KY's (the authority) approximately $180 million of outstanding airport revenue bonds. The Rating Outlook is Stable.
KEY RATING DRIVERS
The rating reflects Louisville International Airport's (SDF) operational diversity, supported by a well-balanced passenger carrier mix and large cargo presence, which together with strong metrics help to offset the relatively small but stable origination and destination (O&D) enplanement base. Steady operational and financial performance in conjunction with United Parcel Service of America's (UPS) growing cargo activity result in a moderate and competitive passenger airline cost per enplanement (CPE) of around $5. Further, the authority's financial position is well positioned and supported by ample reserves, with resolution-based debt service coverage ratios (DSCR) averaging 1.8x in the rating case and leverage declining to below 1x by fiscal year (FY) 2023.
Diversified Carrier Base & Some Cargo Exposure - Revenue Risk (Volume): Midrange
SDF's established service area with limited competition supports the airport's predominantly O&D enplanement base of 1.8 million in FY 2018. SDF's central role in the UPS air freight network as well as UPS's demonstrated commitment to the airport helps diversify SDF's revenue stream from reliance on passenger carriers. However, it also exposes the airport to cargo sector risk that fluctuates significantly with the economy.
Adequate Contractual Framework - Revenue Risk (Price): Midrange
The airline use and lease agreements, one for the terminal facilities and one for the airfield, run through FY 2021. Rate setting utilizes a hybrid compensatory approach, which, coupled with strong non-airline revenue generation, provides adequate overall cost recovery terms. Agreements cover about 50% of the airport's total cost base. SDF's airline charges are comparatively lower than other airports with CPE of $5.23 in FY 2018.
Modest Capital Needs - Infrastructure Renewal/Obsolescence: Stronger
The authority's five-year capital program (FY 2019-FY 2023) of approximately $311 million appears manageable in size and flexible in execution. Funding is largely dependent on federal grants and internal resources, with no plans to issue debt in the next five years. A new program, also funded with mostly internal resources and without additional debt, is anticipated in March 2019 and is expected to consolidate terminal and facility improvements.
Conservative Debt Structure - Debt Structure: Stronger
All debt is fixed rate with a flat-to-declining debt service profile. Annual debt service requirements step down from $24.1 million in 2018 to approximately $16.5 million in 2025 and decline thereafter through maturity in 2038. Covenants are standard for airport sector credits and all bond reserves are cash funded.
Financial Profile
SDF has favorable leverage, calculated as net debt to cash available for debt service (CFADS), of 2.4x in fiscal 2018, complemented by healthy balance sheet liquidity and available reserves (more than 800 days cash). Fitch expects leverage to gradually decline given the lack of new debt over the next five years. Resolution-based DSCR, taking into account SDF's coverage fund and debt service offsets, is 1.9x in FY 2018, with net coverage from cash flow remaining flat in FY 2018 at 1.6x. Fitch expects future coverage ratios to remain at similar levels due to the declining debt service profile and adequate revenue base.
PEER GROUP
Fitch-rated peers include Memphis (MEM; A/Stable) and Alaska (AIAS; A+/Stable) given their dependence on cargo revenues and passenger traffic. SDF benefits from higher coverage (1.9x) in comparison with 1.6x at both MEM and AIAS, stronger liquidity, and lower leverage levels. Despite SDF's stronger metrics, Alaska benefits from a multi-airport system, larger enplanement base and a stronger price assessment due to its fully residual use agreement. Memphis has recently embarked on a large capital program resulting in higher leverage levels.
RATING SENSITIVITIES
Future Developments That May, Individually or Collectively, Lead to Negative Rating Action:
- Major changes in UPS's commitment to the airport for airfreight operations and/or a significant reduction in passenger airline services;
- The authority's inability to manage the airport system cost profile, resulting in volatile or declining debt coverage metrics;
- Though not currently expected, additional debt that leads to either sustained leverage above 4x or to a meaningful dilution of debt service coverage.
Future Developments That May, Individually or Collectively, Lead to Positive Rating Action:
- Given the airport's enplanement base and revenue profile, a higher rating is not expected in the near term.
CREDIT UPDATE
Performance Update
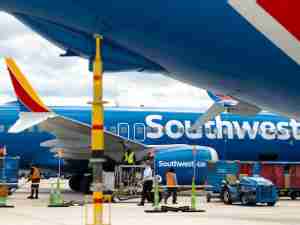
Recent enplanement levels demonstrate strong growth as year-to-date (YTD) enplanements through six months of FY 2019 are up 13% from FYTD 2018. FY 2018 enplanements demonstrated similarly significant growth of 8.1%, up from the near flat growth of the previous three years. Capacity was up 4.6% in FY 2018 and 11% in FYTD 2019. This growth in passenger volume is attributed to changes in air service, which continue to affect traffic, price and nonstop access at the airport. Drivers of the FY 2018 growth include Allegiant Airlines adding service to five destinations and Frontier Airlines adding service to Denver. FYTD 2019 growth has been driven by the addition of new services by Frontier and Southwest. The authority expects that airlines will continue to grow at the airport by providing additional seats to hub markets and improved access to both business and leisure destinations. Cargo landed weight is also experiencing strong growth, up 8.3% FYTD 2019 compared with the same period last year.
FY 2018 financial performance was in line with expectations, with total operating revenues up 1.7% from FY 2017 to $68.7 million, driven by increases in land lease and concession revenues. However, the increase in total operating revenues is offset by operating and maintenance expense growth of 9.4% to $31.3 million. The increase in O&M costs is primarily due to higher than budgeted retirement expenses.
Ground transportation revenues continue to exhibit growth. In FY 2018, parking revenues were up 2% from FY 2017. However, the authority recently approved the outsourcing of parking and shuttle services to a third party, effective March 1. The resulting projected decrease in gross parking revenues is expected to be offset by reduced expenses. The authority is closely monitoring Transportation Network Companies (TNCs) at the airport, but the only material impact has been to taxicabs. In FY 2018, TNC transactions were up 77% over FY 2017, rental car transactions were flat and taxi transactions were down approximately 6%. However, in the same timeframe, combined revenues to the authority for the taxicabs, TNCs and rental cars were up 4%. Two new taxi concession agreements were awarded, effective Jan. 1, 2019. The fee per trip is unchanged; however, the minimum monthly business privilege fee requirement was lowered, which will result in a small decline in revenues. With regards to rental car transactions, management expects to maintain a level of stability despite the broadening TNC market.
Under the authority's new Executive Director, SDF is developing a new Capital Improvement Plan (expected in March 2019). This plan is expected to consolidate a number of terminal and facility improvements into one larger Terminal Enhancement - Improvements project. Projects will include updating terminal infrastructure, replacing jet bridges, improving the rental car areas, and adding moving walkways and additional elevators/escalators. The estimated cost is $100 million-$150 million and is expected to be funded with PFCs, Customer Contract Fees assessed on rental car transactions and cash reserves (including $19 million of AIP funds from a project in the early 1990s that had not been previously reimbursed), as well as a portion of passenger entitlement grants. The authority does not plan to issue bonds to fund the capital plan.
Fitch Cases
Fitch's base case scenario assumes enplanements grow at a 2.5% five-year compound annual growth rate (CAGR), with total operating revenues and expenses growing at CAGRs of 1.2% and 3.0%, respectively. Resolution-based DSCR remains stable compared with current levels with an average of 2.0x and minimum of 1.9x, while CPE remains competitive in the range of $5.29 to $5.72. Fitch-calculated coverage, which excludes the authority's coverage account and counts PFCs as revenues, averages 1.73x with a minimum of 1.69x in FY 2023. Leverage in the base case averages 0.9x and declines to nearly 0x by FY 2023.
Fitch's rating case stresses enplanements with a 7% drop in FY 2020 followed by a moderate recovery from FY 2021-2023, resulting in a -0.8% growth rate over the forecast period. The rating case further assumes that non-aviation revenue follows enplanements with total operating revenues posting a decrease at a five-year CAGR of -0.3%. Additionally, the rating case assumes that O&M expenses grow at an annual rate of 4.0%. Resolution-based DSCR averages 1.8x with a minimum of 1.7x in FY 2023, while CPE remains below $6.65. Fitch-calculated coverage remains above 1.4x and averages 1.5x. Leverage in the rating case averages 1.4x, declining to 0.5x by FY 2023. Results from the base and rating cases demonstrate performance in line with the 'A' rating category.