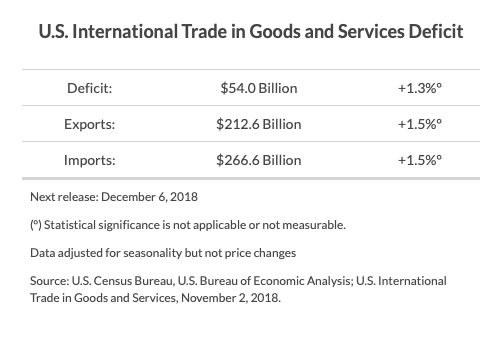
The U.S. Census Bureau and the U.S. Bureau of Economic Analysis announced today that the goods and services deficit was $54.0 billion in September, up $0.7 billion from $53.3 billion in August, revised.
Exports, Imports, and Balance (exhibit 1)
September exports were $212.6 billion, $3.1 billion more than August exports. September imports were $266.6 billion, $3.8 billion more than August imports.
The September increase in the goods and services deficit reflected an increase in the goods deficit of $0.6 billion to $77.2 billion and a decrease in the services surplus of $0.1 billion to $23.2 billion.
Year-to-date, the goods and services deficit increased $40.7 billion, or 10.1 percent, from the same period in 2017. Exports increased $143.8 billion or 8.2 percent. Imports increased $184.5 billion or 8.6 percent.
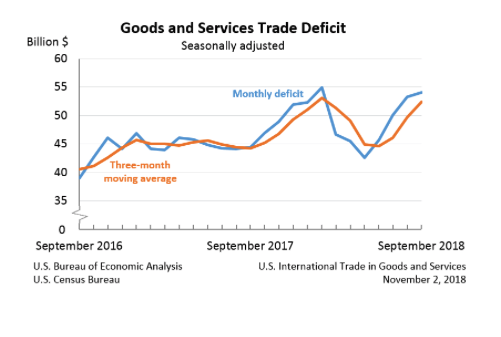
Three-Month Moving Averages (exhibit 2)
The average goods and services deficit increased $2.8 billion to $52.5 billion for the three months ending in September.
- Average exports decreased $0.2 billion to $211.0 billion in September.
- Average imports increased $2.5 billion to $263.5 billion in September.
Year-over-year, the average goods and services deficit increased $8.2 billion from the three months ending in September 2017.
- Average exports increased $14.7 billion from September 2017.
- Average imports increased $22.9 billion from September 2017.
Exports (exhibits 3, 6, and 7)
Exports of goods increased $2.9 billion to $141.9 billion in September.
Exports of goods on a Census basis increased $2.8 billion.
Industrial supplies and materials increased $2.8 billion.
- Other petroleum products increased $1.1 billion.
- Nonmonetary gold increased $1.0 billion.
Capital goods increased $1.1 billion.
- Civilian aircraft increased $1.2 billion.
Foods, feeds, and beverages decreased $1.0 billion.
- Soybeans decreased $0.7 billion.
Net balance of payments adjustments increased $0.1 billion.
Exports of services increased $0.3 billion to $70.7 billion in September.
- Transport increased $0.2 billion.
Imports (exhibits 4, 6, and 8)
Imports of goods increased $3.5 billion to $219.1 billion in September.
Imports of goods on a Census basis increased $3.7 billion.
Capital goods increased $2.4 billion.
- Telecommunications equipment increased $0.5 billion.
- Civilian aircraft engines increased $0.5 billion.
- Computer accessories increased $0.4 billion.
- Computers increased $0.4 billion.
Consumer goods increased $2.0 billion.
- Other textile apparel and household goods increased $0.5 billion.
- Toys, games, and sporting goods increased $0.4 billion.
- Cell phones and other household goods increased $0.3 billion.
Automotive vehicles, parts, and engines decreased $0.6 billion.
- Trucks, buses, and special purpose vehicles decreased $0.6 billion.
Net balance of payments adjustments decreased $0.2 billion.
Imports of services increased $0.4 billion to $47.5 billion in September.
- Transport increased $0.4 billion.
Real Goods in 2012 Dollars – Census Basis (exhibit 11)
- The real goods deficit increased $0.8 billion to $87.0 billion in September.
- Real exports of goods increased $3.1 billion to $151.0 billion.
- Real imports of goods increased $3.9 billion to $238.1 billion.
Revisions to August exports
- Exports of goods were revised up $0.1 billion.
- Exports of services were revised down $0.1 billion.
Revisions to August imports
- Imports of goods were revised down less than $0.1 billion.
- Imports of services were revised up $0.1 billion.
Goods by Selected Countries and Areas: Monthly – Census Basis (exhibit 19)
The September figures show surpluses, in billions of dollars, with South and Central America ($3.2), Hong Kong ($2.4), Brazil ($0.6), and Singapore ($0.1). Deficits were recorded, in billions of dollars, with China ($37.4), European Union ($14.2), Mexico ($7.6), Germany ($5.2), Japan ($4.9), Italy ($2.3), OPEC ($2.3), Canada ($2.2), South Korea ($2.0), India ($1.7), Saudi Arabia ($1.5), France ($1.5), Taiwan ($0.9), and United Kingdom ($0.2).
- The deficit with China increased $3.0 billion to $37.4 billion in September. Exports increased $0.4 billion to $10.2 billion and imports increased $3.5 billion to $47.7 billion.
- The deficit with members of OPEC increased $1.3 billion to $2.3 billion in September. Exports decreased $0.6 billion to $4.6 billion and imports increased $0.8 billion to $6.9 billion.
- The deficit with Mexico decreased $1.1 billion to $7.6 billion in September. Exports increased $1.1 billion to $22.5 billion and imports decreased less than $0.1 billion to $30.1 billion.
Source: U.S. International Trade in Goods and Services: October 2018