The Freight Transportation Services Index (TSI), which is based on the amount of freight carried by the for-hire transportation industry, was unchanged in January from December, according to the U.S. Department of Transportation’s Bureau of Transportation Statistics’ (BTS). From January 2019 to January 2020, the index fell 1.0% compared to a rise of 5.5% from January 2018 to January 2019 and a rise of 6.0% from January 2017 to January 2018.
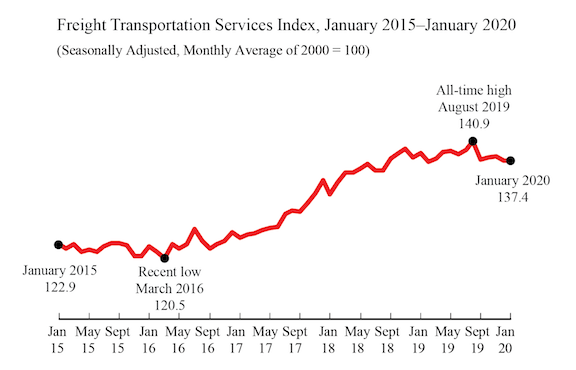
The level of for-hire freight shipments in January measured by the Freight TSI (137.4) was 2.5% below the all-time high level of 140.9 in August 2019 (Table 2A). BTS’ TSI records begin in 2000.
January through December 2019 were revised to reflect changes in data inputs. December 2019 remains below November 2019 as in the previous release.
BTS is withholding the scheduled release of the passenger and combined indexes for January. The passenger index is a statistical estimate of airline passenger travel and other components based on historical trends up to December 2019. As a result, the estimates have yet to fully account for the impact of the coronavirus. Air freight is also a statistical estimate. Since air freight makes up a smaller part of the freight index, the freight TSI is being released as scheduled.
The Freight TSI measures the month-to-month changes in for-hire freight shipments by mode of transportation in tons and ton-miles, which are combined into one index. The in dex measures the output of the for-hire freight transportation industry and consists of data from for-hire trucking, rail, inland waterways, pipelines and air freight. The TSI is seasonally-adjusted to remove seasonality from month-to-month comparisons.
Analysis: The Freight TSI was unchanged in January from December due to declines in water and pipeline, while trucking, rail carload, rail intermodal, and air freight increased. The TSI decline took place against a background of mixed results in other indicators. The Federal Reserve Board Industrial Production (IP) Index declined 0.3% in January reflecting decreases in utilities and manufacturing and an increase in mining. Personal Income grew by 0.6% while housing starts decreased by 3.6%. The Institute for Supply Management Manufacturing (ISM) index returned to indicating growth in manufacturing, increasing 3.1 points to 50.9. The ISM manufacturing index is based on a survey of 800 supply chain executives on production, orders, deliveries, and employment, while the Federal Reserve IP index is based on estimated physical output using a range of output measures that the Federal Reserve considers reliable. Comparisons between patterns in the ISM manufacturing and the Federal Reserve IP index should be done with caution.
Trend: The Freight Index was unchanged in January from December 2019. In fact it was almost unchanged since February 2019, having increased only 0.15% since then. The index remained close to its lowest level since August 2018. However, it remained above any level it had reached before the high of September 2018. In effect, the Freight TSI rose 14.4% from March 2016 to September 2018, but has been essentially stable (declining by 0.4%) since then. The December 2019 index was 44.6% above the April 2009 low during the most recent recession. For additional historical data, go to TSI data.
Index highs and lows: For-hire freight shipments in January 2020 (137.4) were 44.8% higher than the low in April 2009 during the recession (94.9). The January 2020 level was 2.5% below the historic peak reached in August 2019 (140.9) (Table 1A).
Year-to-date: For-hire freight shipments measured by the index were at the same level as in January compared to the end of 2019 (Table 3).
Long-term trend: For-hire freight shipments are up 11.8% in the five years from January 2015 and are up 33.0% in the 10 years from January 2010 (Table 5).
Same month of previous year: January 2020 for-hire freight shipments were down 1.0% from January 2019 (Tables 4, 5).
The TSI has three seasonally-adjusted indexes that measure changes from the monthly average of the base year of 2000. The three indexes are freight shipments, passenger travel and a combined measure that merges the freight and passenger indexes. See Seasonally-Adjusted Transportation Data for numbers for individual modes. TSI includes data from 2000 to the present. Release of the February 2020 index is scheduled for April 8.
Revisions: Monthly data has changed from previous releases due to the use of concurrent seasonal analysis, which results in seasonal analysis factors changing as each month’s data are added.