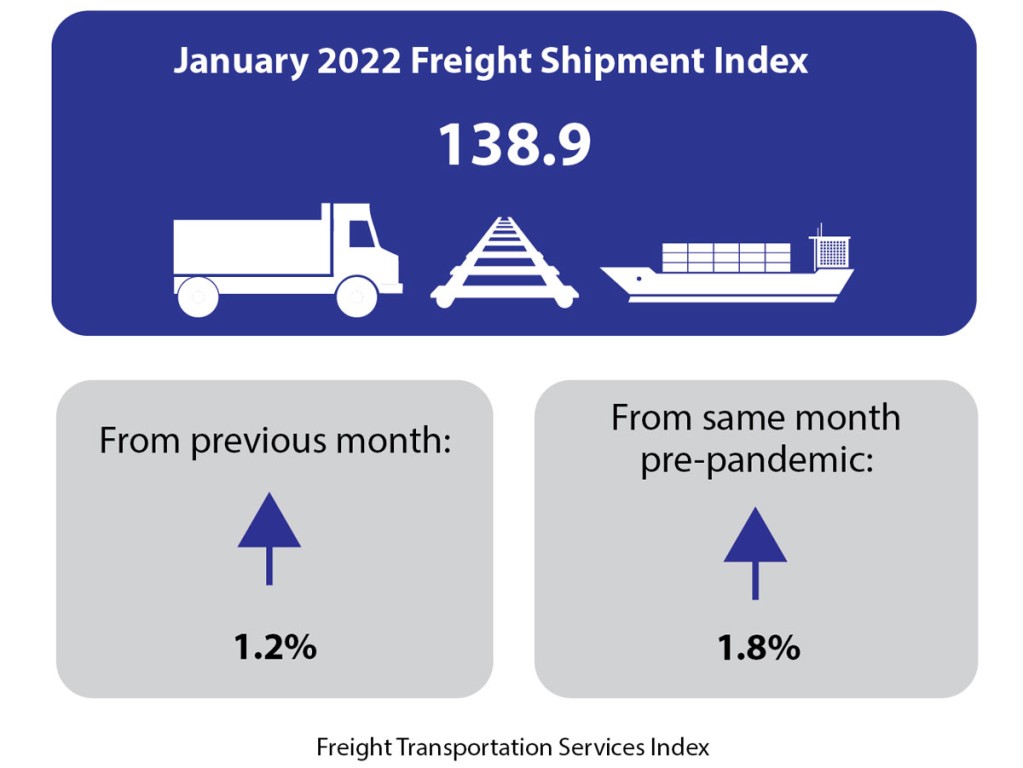
The Freight Transportation Services Index (TSI), which is based on the amount of freight carried by the for-hire transportation industry, rose 1.2% in January from December, rising for the fifth consecutive month, according to the U.S. Department of Transportation’s Bureau of Transportation Statistics’ (BTS). From January 2021 to January 2022 the index rose 1.7 percent compared to a rise of 0.1 percent from January 2020 to January 2021 and a decline of 1.5 percent from January 2019 to January 2020 (Tables 1, 2, and 2A). For-hire freight does not include the operations of fleets owned by retailers or other non-transportation companies referred to as private fleets.
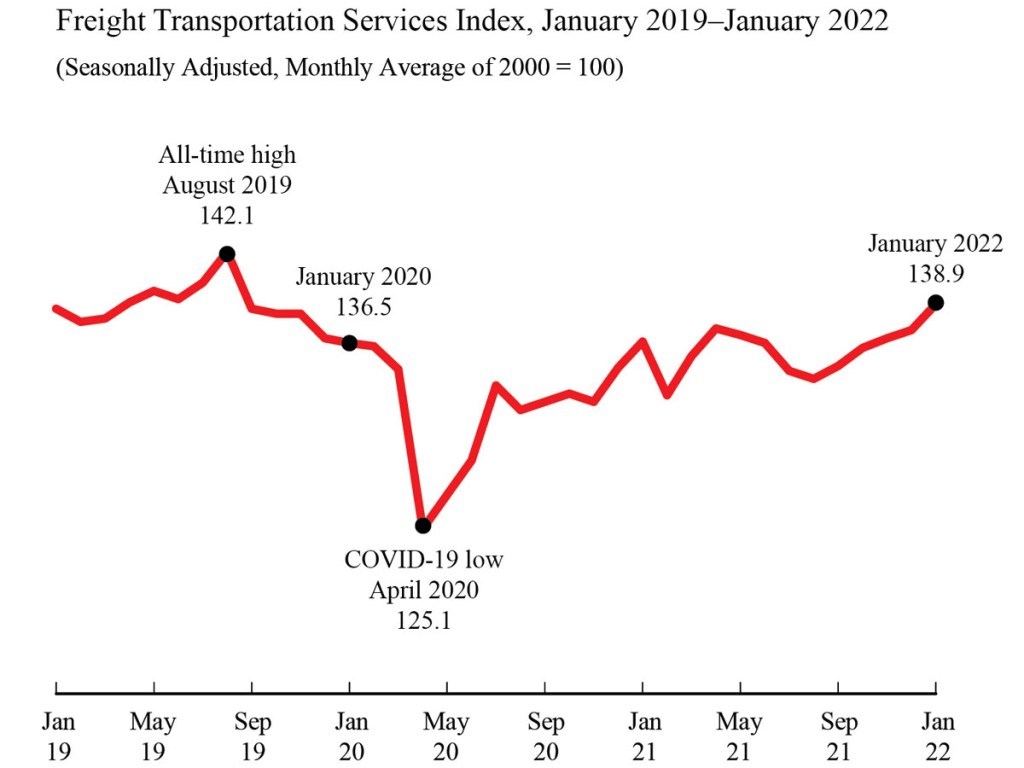
The level of for-hire freight shipments in January measured by the Freight TSI (138.9) was 1.8% above the level of 136.5 in pre-pandemic January 2020 and was 2.3% below the all-time high level of 142.1 in August 2019 (Table 2A). BTS TSI records begin in 2000. See historical TSI data.
The December 2021 index was revised upward to 137.8 from the 136.4 announced in last month’s release. That revision reverts the reported December 2021 decrease to an increase from November 2021 and positions December 2021 as the fourth consecutive month of TSI increase.
BTS is withholding the scheduled release of the passenger and combined indexes for January. The passenger index for January is a statistical estimate of airline passenger travel and other components based on historical trends up to December 2022. The statistical estimate does not fully account for the rapidly changing impacts of the coronavirus on the historical trend. Air freight for January is also a statistical estimate. Since air freight makes up a smaller part of the freight index, the freight TSI is being released as scheduled with the air freight estimate included. The December passenger and combined indexes are available on the BTS website.
The Freight TSI measures the month-to-month changes in for-hire freight shipments by mode of transportation in tons and ton-miles, which are combined into one index. The index measures the output of the for-hire freight transportation industry and consists of data from for-hire trucking, rail, inland waterways, pipelines and air freight. The TSI is seasonally-adjusted to remove regular seasonal movement, which enables month-to-month comparisons.
Analysis
The Freight TSI increased 1.2% in January from December due to seasonally adjusted increases in water, pipeline, and trucking while air freight, rail carloads, and rail intermodal declined.
The January increase came in the context of mixed results for other indicators. The Federal Reserve Board Industrial Production (IP) Index grew by 1.4% in January, reflecting increases of 0.2% in manufacturing, 9.9% in utilities, and 1.0% in mining. Housing starts were down 4.1%, and personal income increased by less than 0.1%.
The Institute for Supply Management Manufacturing (ISM) index was down 1.2 points to 57.6, indicating slowing growth in manufacturing.
Although the January Passenger TSI is being withheld because of the previously cited difficulty of estimating airline passenger travel and other components, the December index is now being released. The index decreased 1.0% from November to December following an increase of 6.5% in November. Seasonally adjusted transit grew; air passenger travel declined; and rail passenger travel was stable.
The Passenger TSI has now exceeded its level in March 2020 —the first month of the pandemic— for seven months in a row but remains below its pre-pandemic level (February 2020) for the 22nd consecutive month.
Trend
The January freight index increase was the fifth consecutive month-over-month increase, for a total increase of 3.4% since August 2021. This followed four months of decline and left the index 1.1% above its level of April 2021. The January Freight TSI is 11.0% above the pandemic low in April 2020; the increase in January was the 14th increase in the 21 months since that low. The index is 2.3% below its record level of 142.1 set in August 2019 and has increased in 14 of the 29 months since that peak. It is now at its highest point since that record level.
For additional historical data, consult TSI data.
Index highs and lows: For-hire freight shipments in January 2022 (138.9) were 46.2% higher than the low in April 2009 during the recession (95.0). The January 2022 level was 2.3% below the historic peak reached in August 2019 (142.1) (Table 1A).
Year to date: For-hire freight shipments measured by the index were up 1.2% in January compared to the end of 2021 (Table 3).
Long-term trend: For-hire freight shipments are up 12.0% in the five years from January 2017 and are up 24.6% in the 10 years from January 2012 (Table 5).
Same month of previous year: January 2022 for-hire freight shipments were up 1.7% from January 2021 (Tables 4, 5).
The TSI has three seasonally-adjusted indices that measure changes from the monthly average of the base year of 2000. These are freight shipments, passenger travel, and a combined measure that merges the freight and passenger indices. See Seasonally-Adjusted Transportation Data for numbers for individual modes. TSI includes data from 2000 to the present. Release of the February 2022 index is scheduled for April 13, 2022.
Revisions
Monthly data has changed from previous releases due to the use of concurrent seasonal analysis, which results in seasonal analysis factors changing as each month’s data are added.