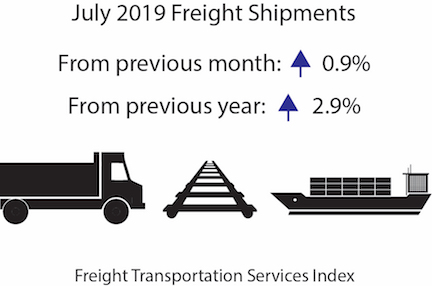
The Freight Transportation Services Index (TSI), which is based on the amount of freight carried by the for-hire transportation industry, rose 0.9% in July from June, rising to a new all-time high after declining for two consecutive months, according to the U.S. Department of Transportation’s Bureau of Transportation Statistics’ (BTS). From July 2018 to July 2019, the index rose 2.9% compared to a rise of 6.0% from July 2017 to July 2018 (Tables 1, 2, and 2A)
The June index was revised to 137.7 from 138.0 in last month’s release. BTS’ TSI records begin in 2000. See historical TSI data.
The Freight TSI measures the month-to-month changes in for-hire freight shipments by mode of transportation in tons and ton-miles, which are combined into one index. The index measures the output of the for-hire freight transportation industry and consists of data from for-hire trucking, rail, inland waterways, pipelines and air freight. The TSI is seasonally-adjusted to remove regular seasons from month-to-month comparisons.
Analysis: The July Freight TSI 0.9% rise was broad based with increases in rail carloads, rail intermodal, trucking, pipeline and air freight. There was a small decline in water transportation. The TSI increase took place against a background of mixed results for other indicators. The Federal Reserve Board Industrial Production Index declined in July, reflecting decreases in mining and manufacturing and an increase in utilities. Personal income increased by 0.1%, while housing starts declined by 4.0%. The Institute for Supply Management Manufacturing index decreased 0.5 points to 51.2, indicating continued but slowing growth.
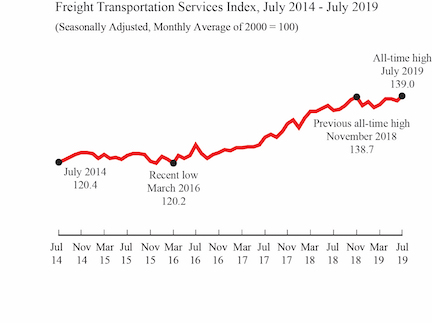
Trend: The July increase of 0.9% brought TSI to a record high level. Despite small decreases in both May (-0.1%) and June (-0.3%), the July index was 0.6% over its April level and 0.2% over its previous record high in November 2018. The record high level was reached even though the index increased in only four of the eight months since November. From a low point in March 2016, the index climbed 12.8% until reaching a new high in May 2018. From that point, the index has exceeded its levels in all months prior to May 2018. The July 2019 index was 46.6% above the April 2009 low during the most recent recession. For additional historical data, go to TSI data.
Index highs and lows: For-hire freight shipments in July 2019 (139.0) were 46.6% higher than the low in April 2009 during the recession (94.8). The July 2019 level reached its all-time high (Table 1A).
Year-to-date: For-hire freight shipments measured by the index were up 2.1% in July compared to the end of 2018 (Table 3).
Long-term trend: For-hire freight shipments are up 15.4% in the five years from July 2014 and are up 41.4% in the 10 years from July 2009 (Table 5).
Same month of previous year: July 2019 for-hire freight shipments were up 2.9% from July 2018 (Tables 4, 5).
The TSI has three seasonally-adjusted indexes that measure changes from the monthly average of the base year of 2000. The three indexes are freight shipments, passenger travel and a combined measure that merges the freight and passenger indexes. See Seasonally-Adjusted Transportation Data for numbers for individual modes. TSI includes data from 2000 to the present. Release of the August 2019 index is scheduled for Oct. 9.
Passenger Index: The TSI for passengers rose 0.4% in July from its June level (Table 6). The Passenger TSI July 2019 level of 135.2 was 3.0% above the July 2018 level (Table 7). The index is up 13.1% in five years and up 23.0% in 10 years (Table 5). The passenger TSI measures the month-to-month changes in travel that involves the services of the for-hire passenger transportation sector. The seasonally-adjusted index consists of data from air, local transit and intercity rail.
Combined Index: The combined freight and passenger TSI rose 0.7% in July from its June level (Table 8). The combined TSI July 2019 level of 137.8 was 2.9% above the July 2018 level (Table 9). The combined index is up 14.6% in five years and up 35.4% in 10 years (Table 5). The combined TSI merges the freight and passenger indexes into a single index.
Revisions: Monthly data has changed from previous releases due to the use of concurrent seasonal analysis, which results in seasonal analysis factors changing as each month’s data are added.
BTS research has shown a clear relationship between economic cycles and the Freight and Passenger Transportation Services Indexes. See a study of this relationship using smoothed and detrended TSI data. Researchers who wish to compare TSI over time with other economic indicators, can use the FRED database, which includes freight, passenger and combined TSI, and which makes it possible to easily graph TSI alongside the other series in that database.